The Hidden Story in OSHA Data: A Guide to Proactive Safety
Perspectivas Industriales
13 jun 2026

June is widely recognized across industries as National Safety Month. For many organizations, it is a time for standard safety stand-downs, renewed toolbox talks, and routine reminders to wear personal protective equipment. But when you look beneath the surface of the "Safety Month" banners, there is a much bigger story playing out—one built on millions of data points collected from real people performing daily tasks.
The ultimate goal of modern safety management should not be to police worker behaviors or simply check off compliance boxes. It should be to build workplaces resilient enough to tolerate human error and keep people safe. To achieve that, we must view federal tracking systems not as bureaucratic text walls but as a living map that points directly to operational risks before they cause life-altering harm.
The Evolution of Risk Visibility: From Hidden Logs to Public Transparency
For a long time, workplace injury logs were mostly buried in filing cabinets, only seeing the light of day during an active inspection or internal review. That started changing back in 2016 when OSHA issued its Electronic Injury and Illness Reporting Rule. For the first time, certain establishments were required to submit their annual injury summaries directly to OSHA via a new web portal called the Injury Tracking Application (ITA).
Then, in 2023, OSHA revised and expanded these electronic reporting requirements. It wasn't enough to just look at year-end, high-level summaries anymore; the updated rules mandated that specific high-risk establishments also electronically submit the case-by-case data from their deeper logs (Forms 300 and 301).
By eventually publishing this employer-reported data directly on its website, OSHA transformed compliance into a collaborative tool. The goal was simple: make the data widely available so employers and environmental health and safety (EHS) professionals could understand broader industry trends, catch hidden hazards, and improve workplace safety. This exact policy shift is what brings us to the present day, allowing us to analyze the newly released 2024 employer data.
Discover the 2026 OSHA Data Playbook in our latest whitepaper.
Demystifying the Tracking Ecosystem: The Stories Behind the Forms
When the Occupational Safety and Health Administration (OSHA) talks about workplace safety trends, it relies on a specific set of tools and data trackers to paint a picture of national risk. Understanding what these acronyms and form numbers mean shifts our perspective from cold compliance to actionable visibility:
1. OSHA Form 300A: The Annual Snapshot
This summary compiles the collective, high-level numbers of recordable injuries, illnesses, and fatalities at the end of every year. It serves as an establishment's public-facing safety scorecard, showing the total operational footprint without individual employee names.
2. OSHA Forms 300 & 301: The Log and Personal Narratives
Form 300 is the ongoing log where companies record details about every recordable injury or illness as it happens. Form 301 is the individual "Injury and Illness Incident Report." This is where the data gets personal. Form 301 captures the raw narrative descriptions—written by workers and supervisors—explaining exactly what happened, where it hurt, and why the event occurred.
Form 300 acts as a running log of incidents, while Form 301 focuses on highly specific data categories such as Nature, Body Part, Source, and Event.
This is where data gets human; Form 301 captures the raw narrative text to show exactly what happened, where it hurt, and why an incident occurred.
3. The Injury Tracking Application (ITA): The National Portal
The ITA is a secure online database managed by the federal OSHA where specific establishments are required to electronically submit their form data annually. Over 370,000 establishments electronically submit their data to the federal database. This system aggregates thousands of isolated spreadsheets into a centralized, living map of operational risk.
4. Severe Injury Reports (SIR): The Urgent Triggers
This dedicated tracking stream isolates high-consequence, critical emergencies from annual summaries. It mandates that employers immediately report workplace fatalities within 8 hours, or severe injuries like hospitalizations and amputations within 24 hours.
The Reality Check: Key Insights from the Latest Data
Looking at the figures compiled from the federal summaries, the data reveals a stark truth about where danger actually concentrates in modern operations:
The Scale of the Challenge: A staggering total of 1,312,738 work-related injuries were reported to OSHA in a single year.
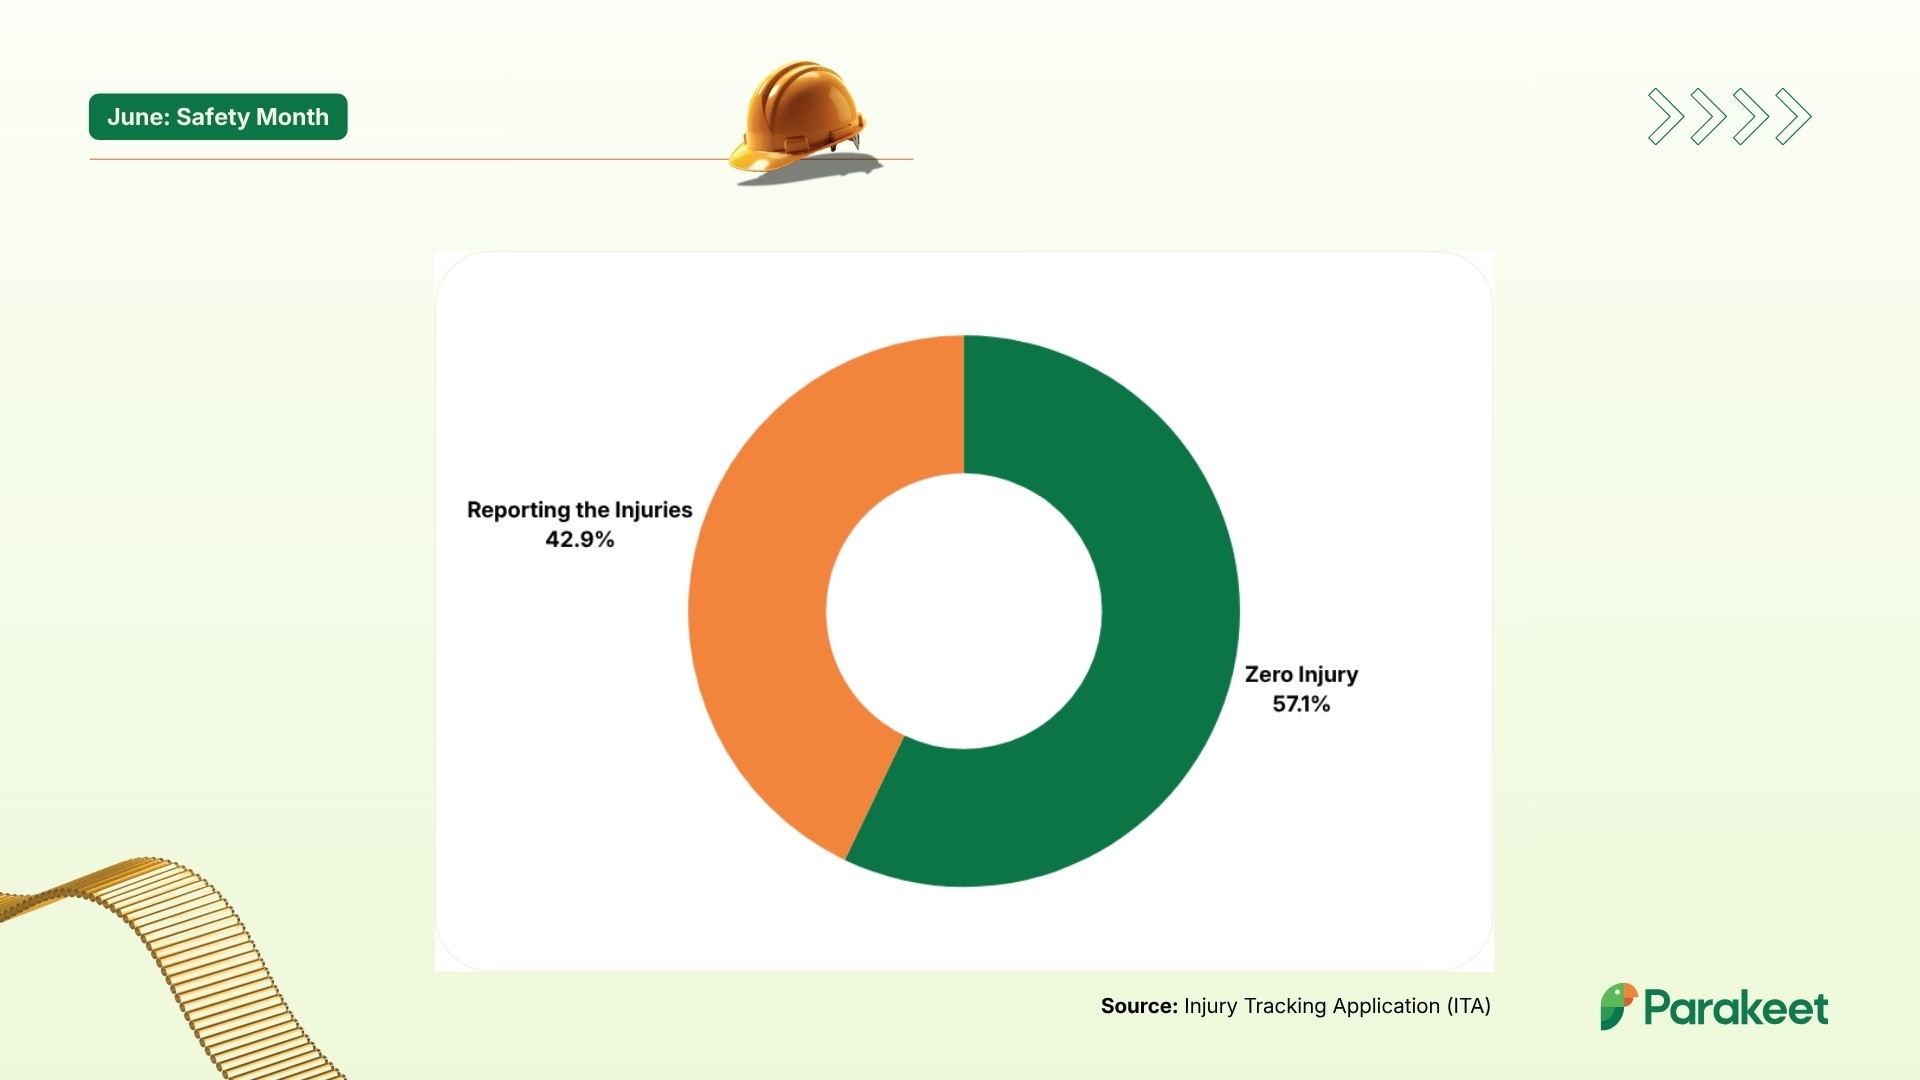
The "Zero Harm" Illusion: At first glance, the national data looks incredibly encouraging, showing that a quiet majority of 227,679 facilities reported zero injuries or illnesses. However, this success masks a troubling reality, as the nationwide toll of 1.38 million injuries didn't disappear.
The Concentration of Risk: Less than half of the country's workplaces carried the burden of every single recorded injury. While 57.1% of workplaces kept their teams entirely safe, the remaining 42.9% carried the weight of every single workplace injury logged across the country.
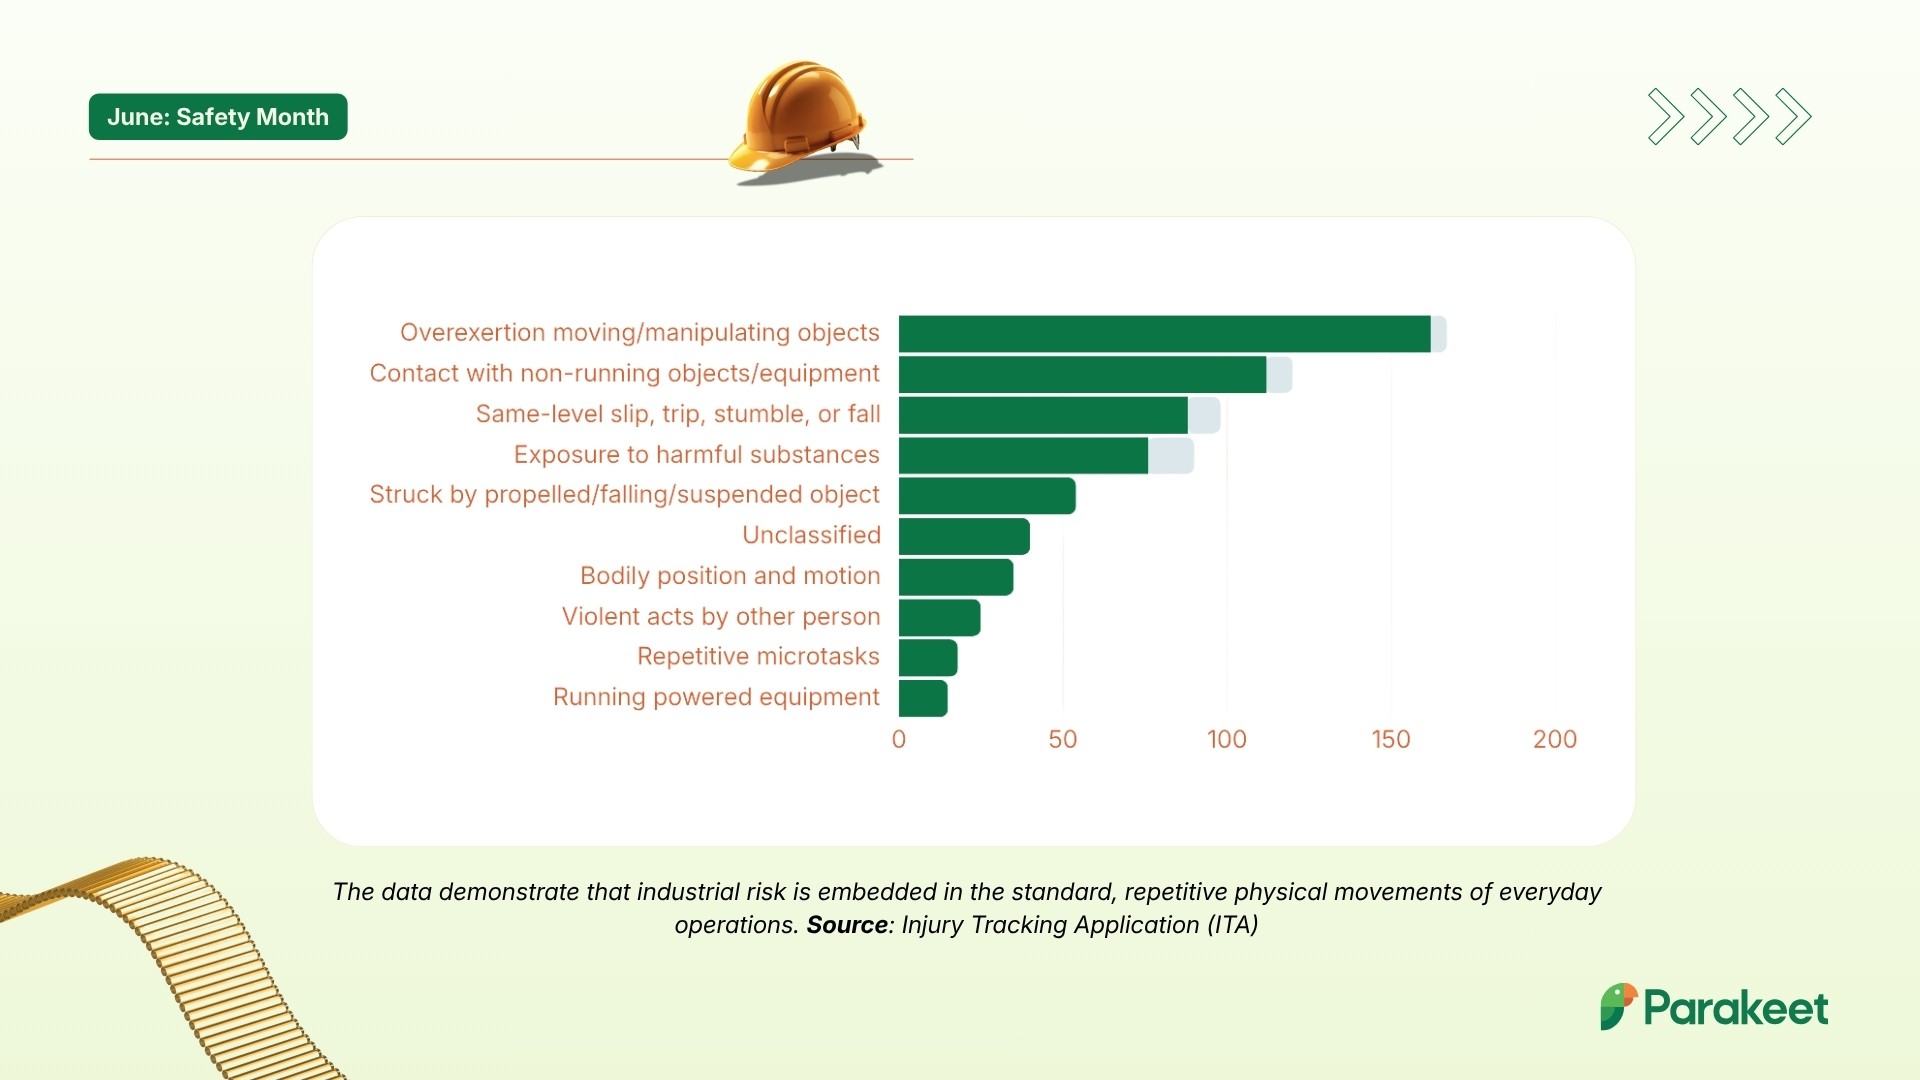
The Everyday Routine Trap: Frontline harm is overwhelmingly driven by routine, everyday work design rather than unexpected failures. When over 70% of all field injuries sit within just a handful of predictable event families—like overexertion, slips, and object handling—generic safety slogans lose their value.
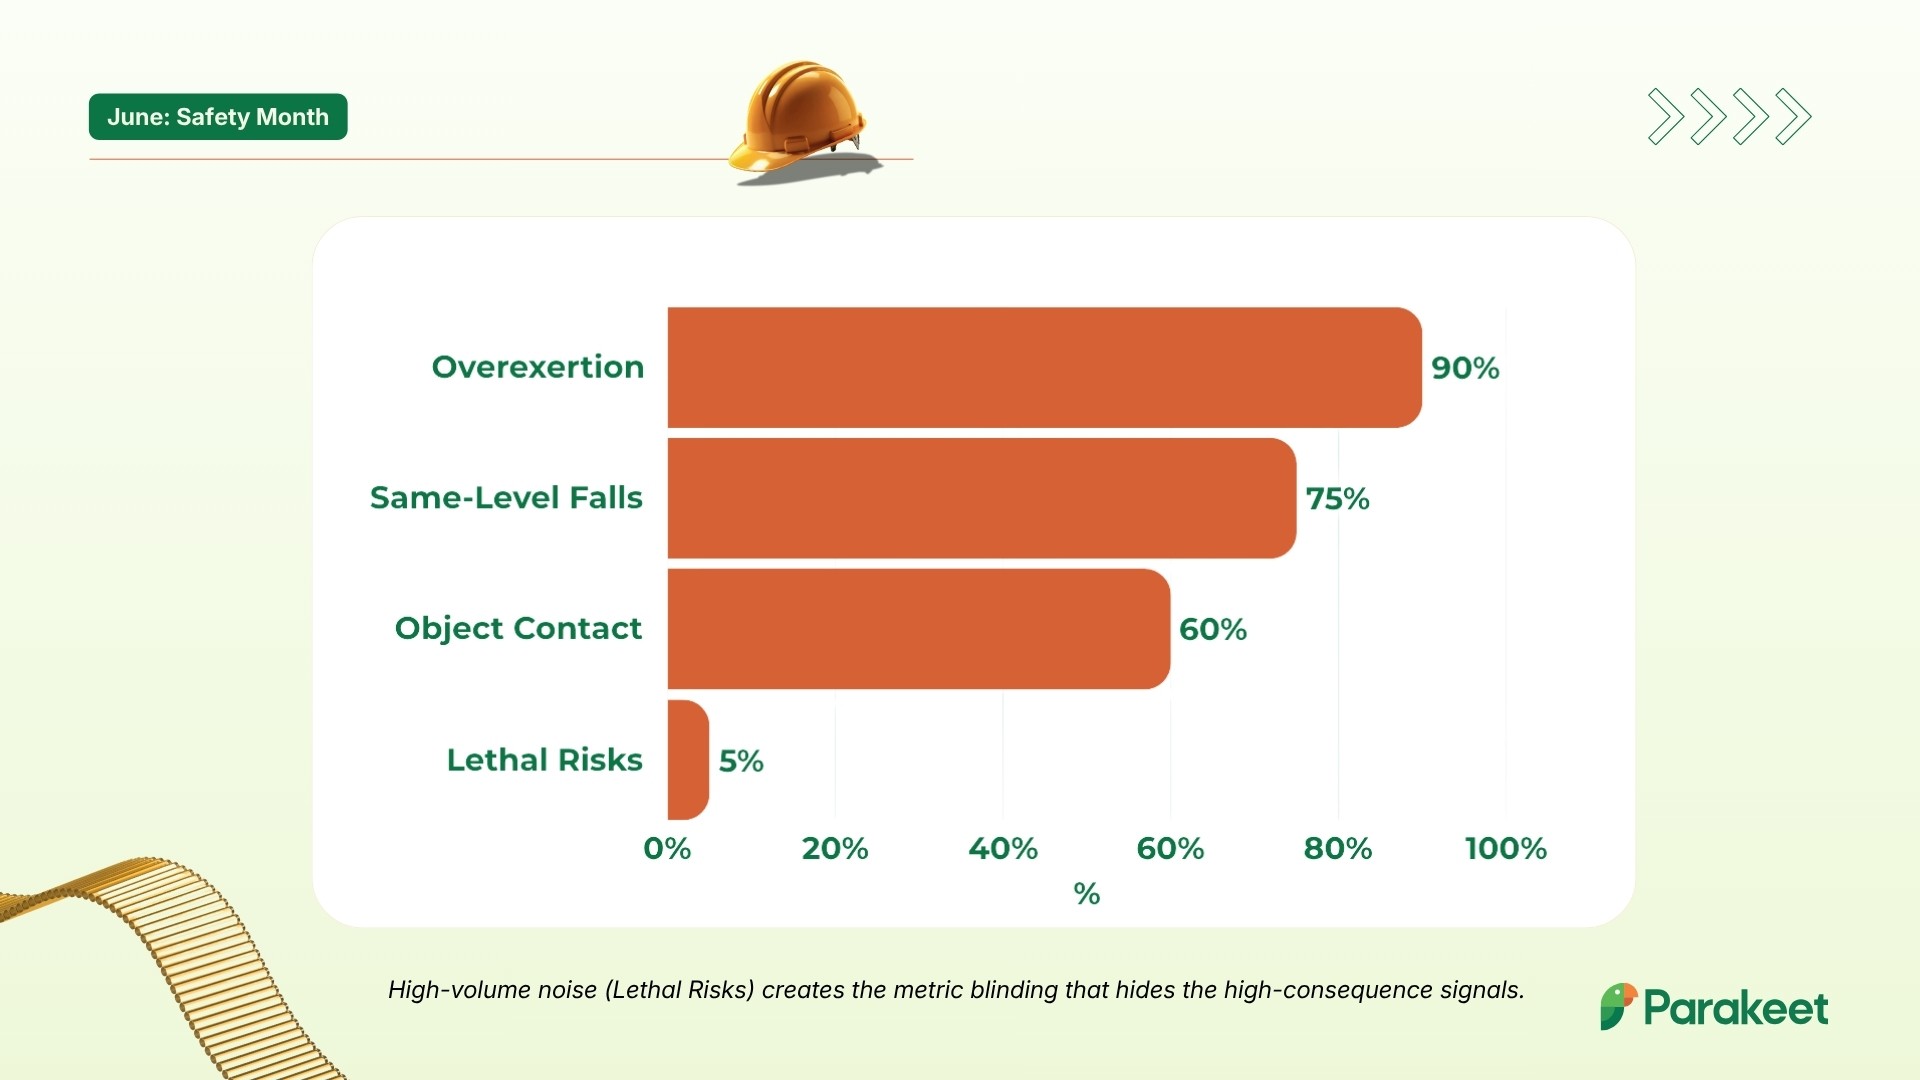
⚠️ Beware the "Volume Trap"
One of the greatest dangers in corporate safety management is metric blinding. Because safety dashboards are flooded with minor injury reports, compliance teams often spend 90% of their time policing minor behavior flaws. Meanwhile, severe, low-frequency risks go completely unmanaged. Landmark safety research reveals that a company's Total Recordable Incident Rate (TRIR) is 98% random and has no statistical relationship with actual fatalities.
Conclusion: Why Risk Visibility Saves Lives
The ultimate lesson of National Safety Month is that compliance is not the finish line.
An industrial facility can be 100% compliant with prescriptive OSHA paperwork while remaining highly vulnerable to systemic failures.
True safety requires surgical risk visibility. It means moving past the easy trap of pointing fingers at human error and looking instead at how the system is designed. When organizations use modern tools to evaluate raw narratives, isolate serious injury and fatality (SIF) precursors, and implement hard engineering and structural controls, they shift from a reactive compliance posture to a proactive culture of preservation.
By making hidden risks visible, we protect your industrial operations, strengthen your compliance teams, and ensure that every contractor returns home safely at the end of their shift. Contact us to find out more!
