

In this article
- What Is Contractor Risk Drift?
- The 2026 Contractor Risk Drift Index: An Industry Warning
- The Illusion of "Approved": Why Static Contractor Prequalification Fails in a Dynamic Market
- The 364-Day Blind Spot: Static Approval vs. Continuous Monitoring
- Risk Macro Trends: What the 2026 Public Records Reveal
- 1. Rising Bankruptcies Hidden by Sector Averages
- 2. Fewer Inspections Do Not Equal Safer Sites
- 3. Persistent Severe Injuries
- 4. The Trap of Non-Synchronized Risk Signals
- The Solution: A Unified, Pillar-Weighted Framework
- How to Construct the Risk Drift Index?
- From Detection to Owned Action: A 6-Step Checklist for Managing Subcontractor Risk
- The New Rules for Managing Contractor Risk in 2026
You prequalified your core subcontractors six months ago. Their financials looked stable, their safety programs were signed off, and their insurance certificates were up to date. The question remains: when was the last time you checked if those conditions still hold true?
In the construction and capital projects sectors, prequalification acts as the ultimate gatekeeper. However, because standard prequalification only captures a single point in time, it fails to account for the dynamic nature of contractor risk. Between annual vendor reviews, operational pressures build quietly. This gradual, unmonitored deterioration of a contractor's stability is known as Risk Drift.
What Is Contractor Risk Drift?
Risk rarely manifests as a sudden, unpredictable catastrophe. Instead, it is a slow "drift" that leaves clear tracks in public data long before resulting in insolvency or a fatal jobsite incident.
Risk Drift is the unobserved decline in a contractor’s financial health, safety adherence, regulatory standing, or delivery capacity after their initial project approval.
In a static risk management model, these escalating public signals go completely unnoticed for up to 365 days, leaving your organization exposed to severe, unmitigated liabilities.
The 2026 Contractor Risk Drift Index: An Industry Warning
To quantify this phenomenon across the supply chain, the Contractor Risk Drift Index tracks observable risk signals against historical baselines. A risk drift index in contractor prequalification measures how a vendor's risk profile changes over time. It tracks negative shifts in financial stability, safety metrics, and regulatory exposure from the initial vetting stage through project execution. The index at 113.7 indicates an exceptionally volatile environment.
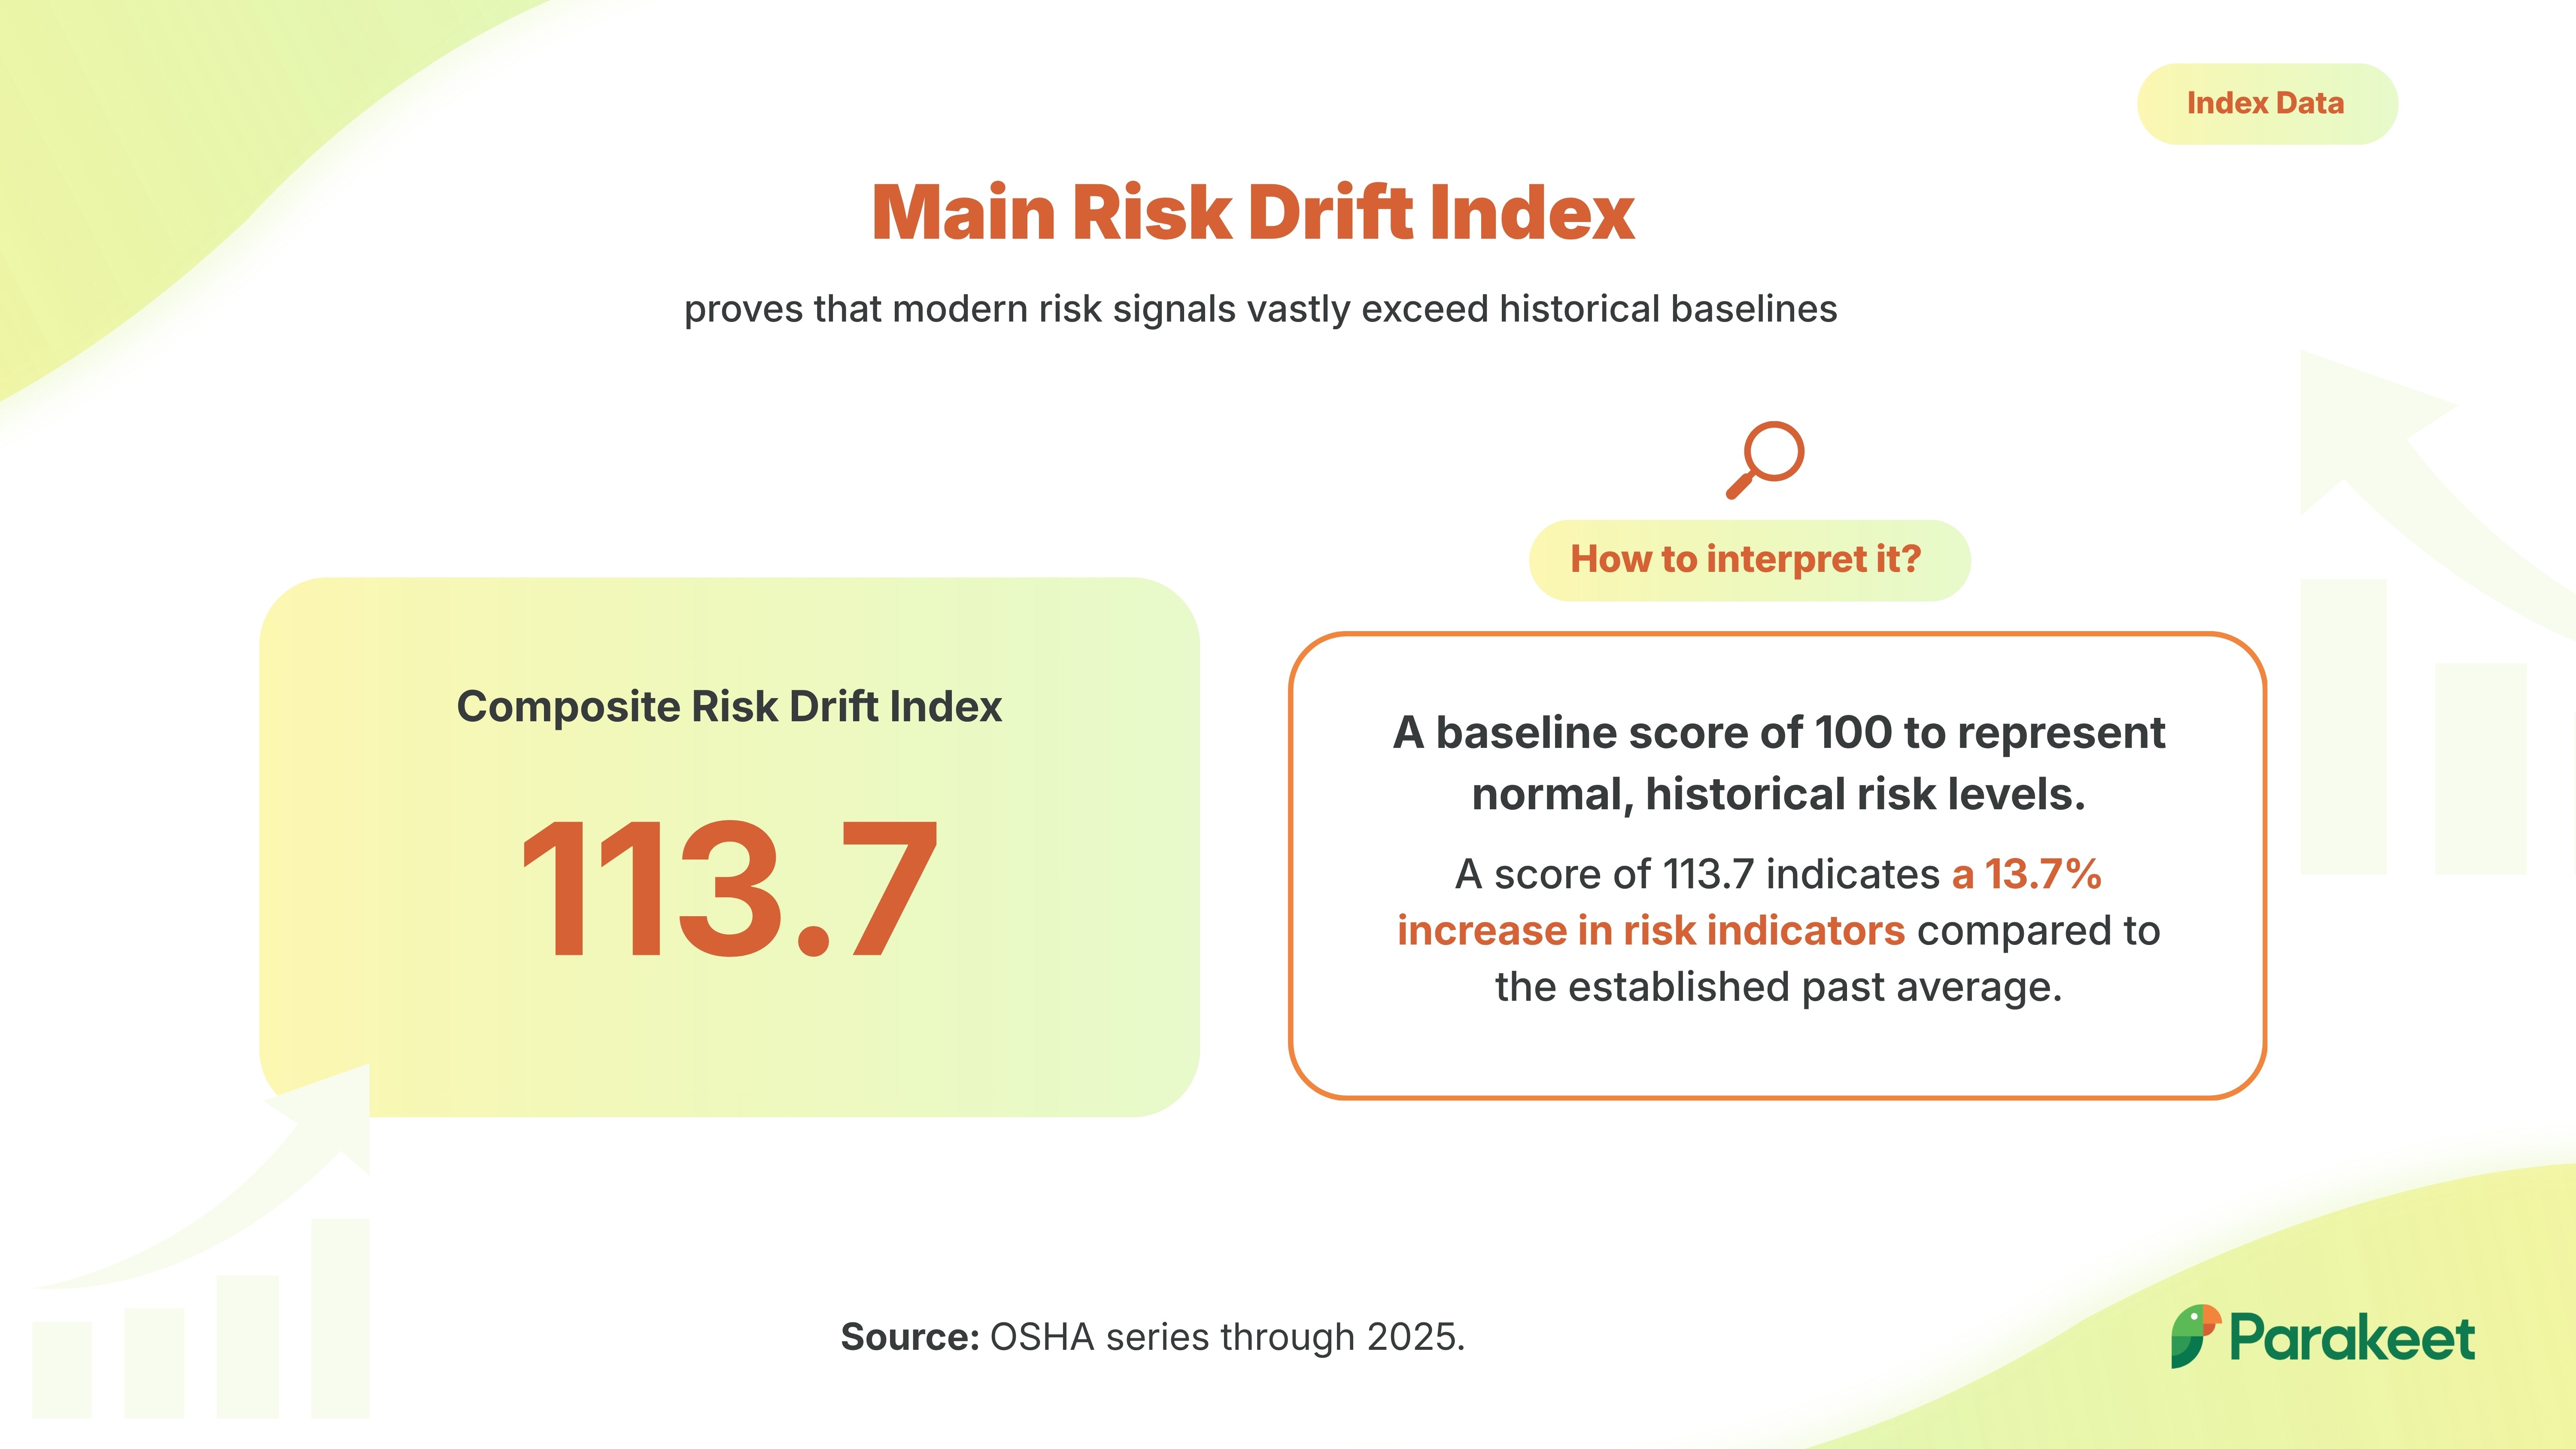
Here is the exact breakdown of how to interpret that specific figure:
1. Significant Departure From the Baseline
The index uses a baseline score of 100 to represent normal, historical risk levels. The current reading of 113.7 represents a 13.7% spike in systemic risk indicators across the industry ecosystem.
2. Highly Concentrated Ecosystem Danger Signals
The score shows that risk signals are currently highly elevated across the entire subcontractor network. It reflects widespread, concurrent vulnerabilities building up across multiple pillars—specifically escalating financial distress, severe jobsite injuries, and regulatory non-compliance.
3. A Leading Indicator of Future Failures
Because risk drifts slowly before a collapse, a 113.7 rating serves as an early warning sign. Without immediate risk mitigation, the industry is positioned for a wave of subcontractor insolvencies, project abandonments, and catastrophic jobsite incidents.
The Illusion of "Approved": Why Static Contractor Prequalification Fails in a Dynamic Market
In a large number of enterprise procurement procedures, contractor prequalification is seen as a final step, a "set it and forget it" checkbox that is carried out on an annual basis. Yet this reliance on static, periodic inspections is a serious systemic flaw. Although a contractor may meet all the compliance requirements on the day they are approved, their level of operational stability is rarely maintained.
The 364-Day Blind Spot: Static Approval vs. Continuous Monitoring
Depending only on an annual contractor prequalification review results in a 364-day blind spot. To protect project timelines and worker safety, organizations must transition from static approvals to continuous risk monitoring.
Continuous monitoring turns a constantly changing external data point into an internal control action with verifiable evidence that can be closed.
The comparison between static approval and continuous risk monitoring:
Feature | Static Approval Model | Continuous Monitoring Model |
|---|---|---|
Data Collection | Single snapshot date per year | Real-time public & private event tracking |
Workflow | Periodic, manual updates | Automated evidence requests triggered by events |
Risk Visibility | Blind to drift between reviews | Immediate escalation and remediation |
Operational Impact | Reactive damage control | Proactive threat neutralization |
Continuous monitoring transforms fluctuating external data points into verifiable, internal control actions that can be systematically mitigated and closed before impacting a project.
Organizations that use a "Static Approval" approach—that is, gathering evidence only once and then ignoring any "drift" until the next manual update—are suffering from a serious gap in visibility.
Continuous risk monitoring transforms fluctuating external data points into verifiable, internal control actions that can be systematically mitigated and closed before impacting a project. This approach recognizes that risk is dynamic and that any change event demands immediate action to resolve the identity and reevaluate the controls as part of a broader industrial third-party risk assessment strategy.
Between formal reviews, public data signals build up.
For example, a contractor might be approved on Day 0, but a new severe injury report (SIR) could appear on Day 47. Then a major regulatory citation update would occur on Day 96 and a financial distress signal on Day 151.
In a static model, these signals are not taken into account for up to 365 days, which leaves the organization exposed to unmitigated risk.
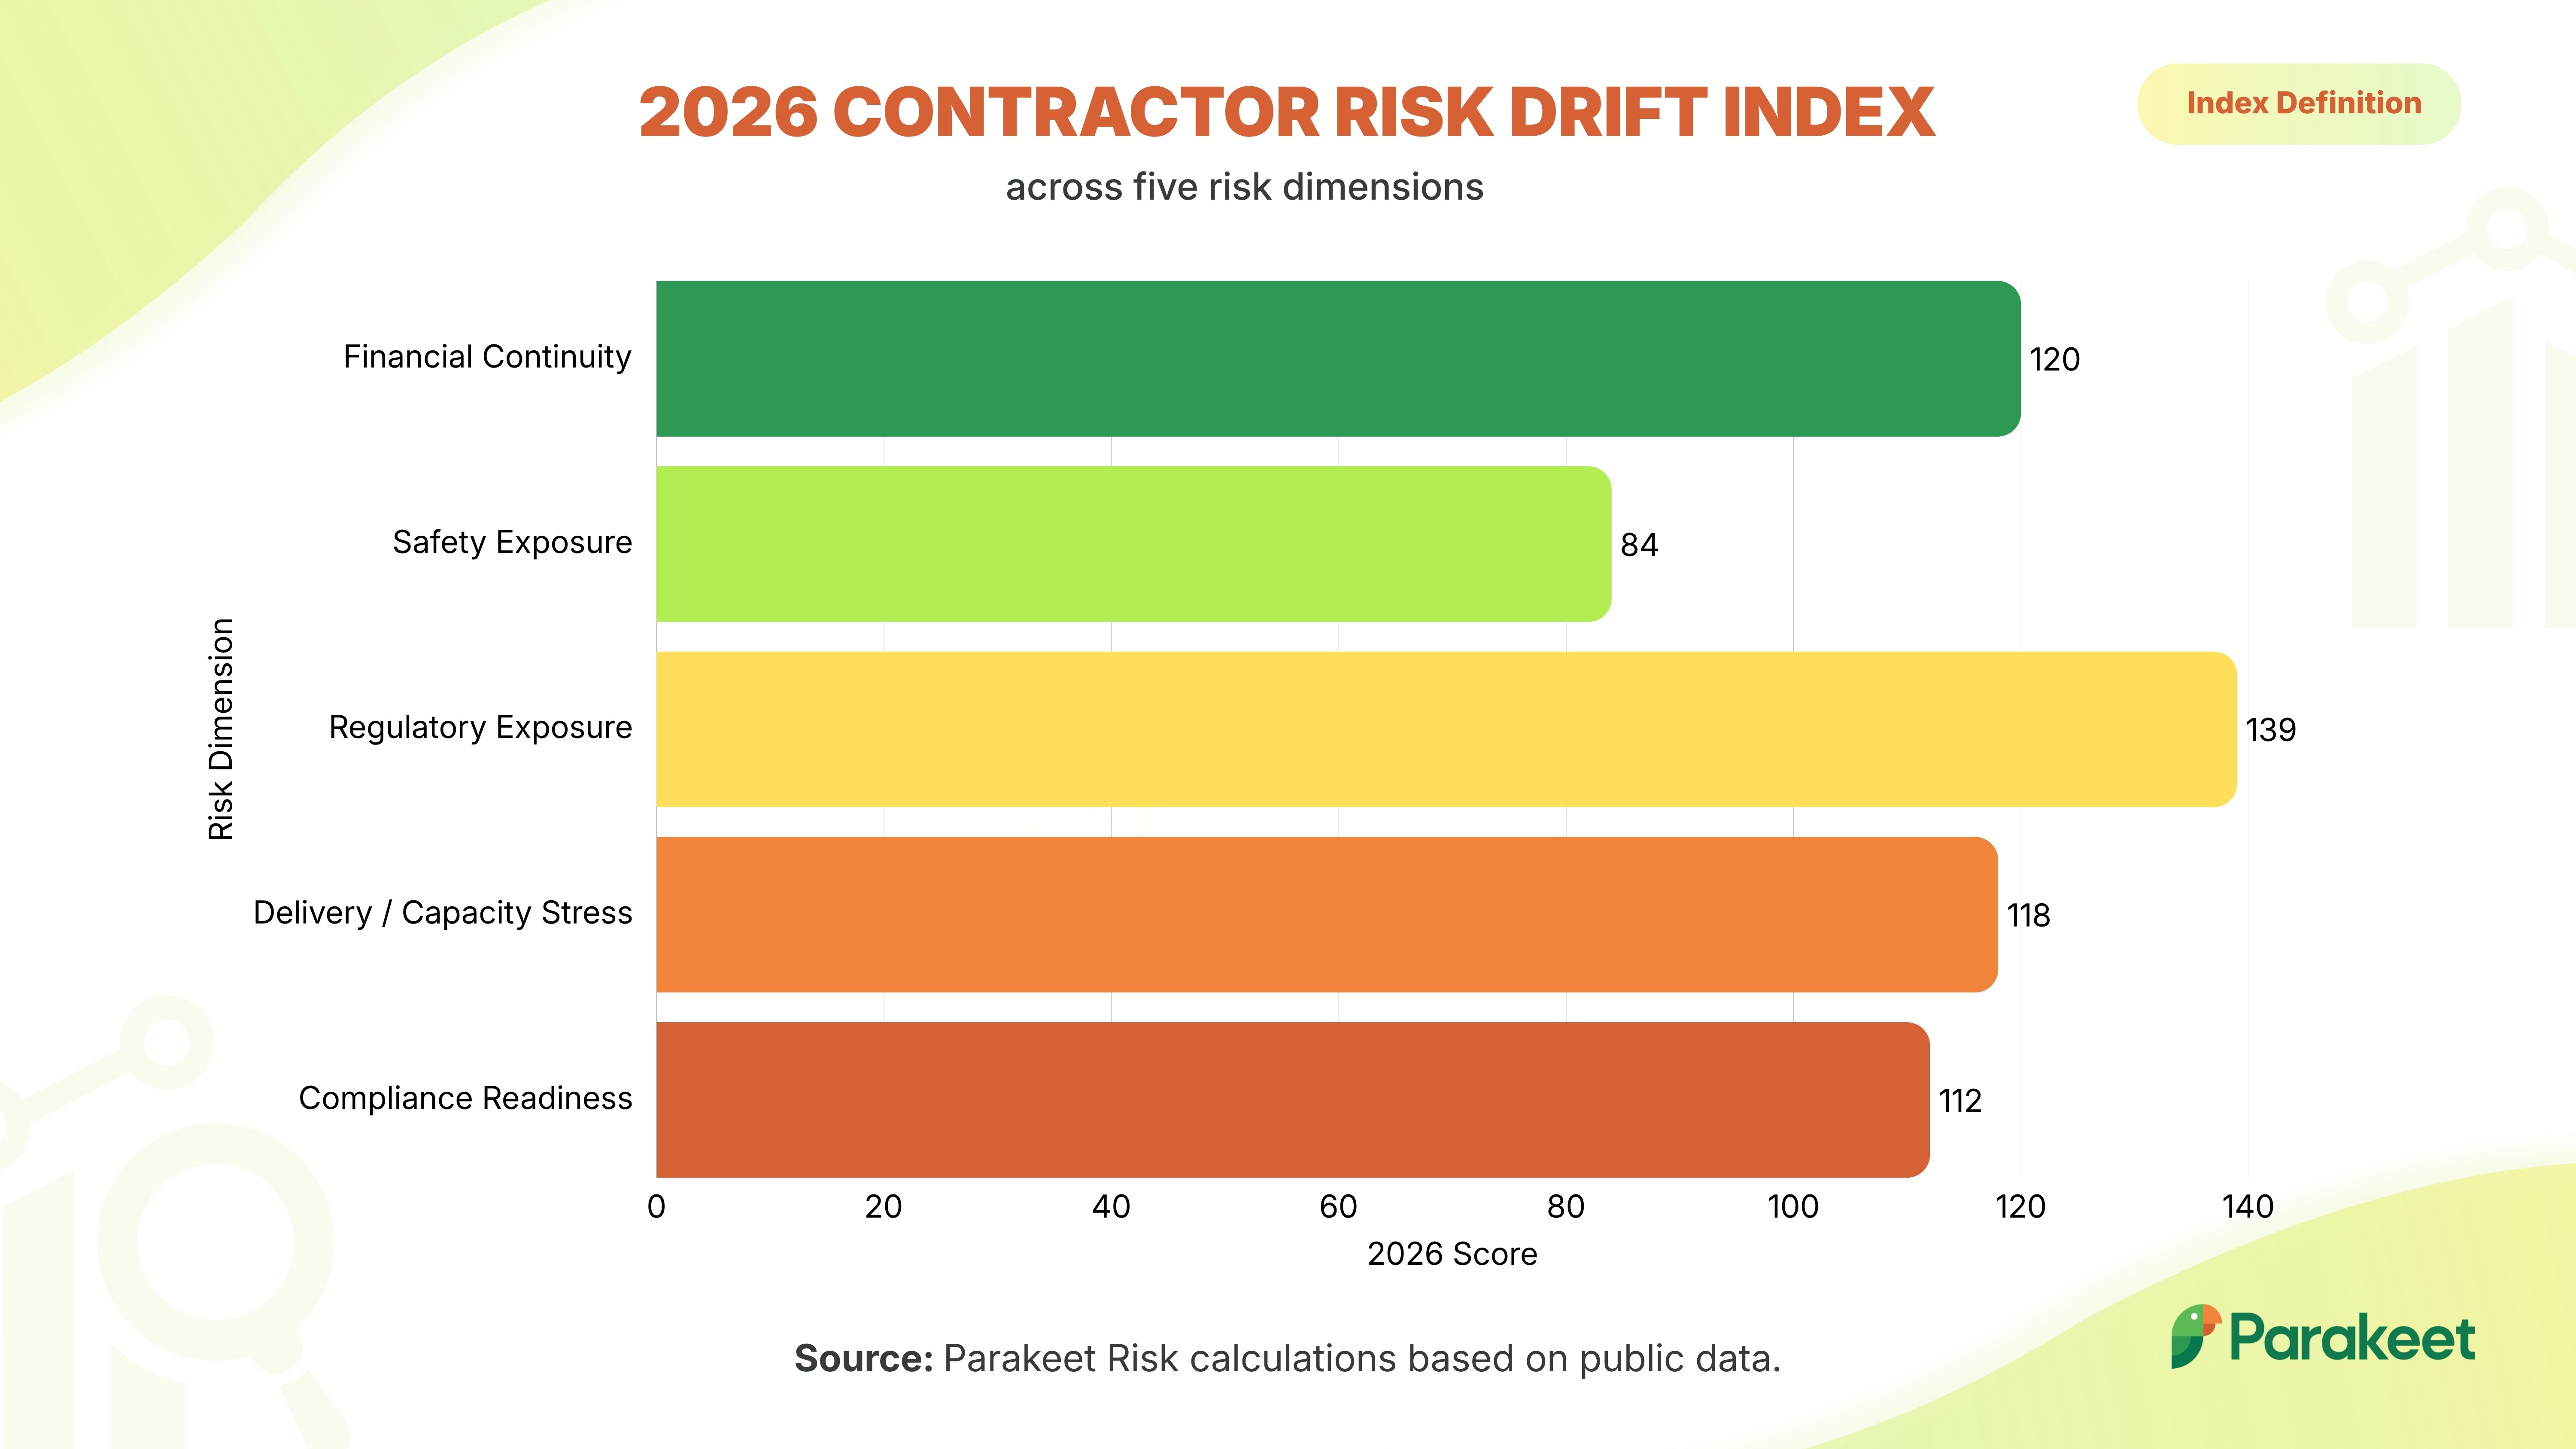
To account for these signals, we employ a pillar-weighting methodology to monitor risk drift across five key domains:
- Financial Continuity,
- Safety Exposure,
- Regulatory Exposure,
- Delivery/Capacity,
- Compliance Readiness.
Public records indicate that risk levels within these pillars—particularly around enforcement actions and the recency of evidence—frequently shift after approval.
Risk Macro Trends: What the 2026 Public Records Reveal
A deep dive into public regulatory records across the US and UK highlights the specific drivers behind the current Index spike:
1. Rising Bankruptcies Hidden by Sector Averages
While high-level regional data may suggest economic stabilization, underlying financial stress remains acute. In the US, business bankruptcy filings surged 16.9% year-on-year to 26,941. Meanwhile, UK construction insolvencies dipped slightly to 3,852 over a rolling 12-month period (a 4.3% decrease), yet they remain pinned near historical highs.
2. Fewer Inspections Do Not Equal Safer Sites
A common error in strategic risk assessment is equating a "clean" regulatory record with excellent safety performance. In FY2025, Federal OSHA inspections dropped 12.6% to 30,273. However, this reduction reflects agency capacity and targeting shifts—not safer jobsites.
Despite fewer inspections, inspectors found 79,199 "Serious" violations. If a contractor is inspected, the probability of a severe citation remains remarkably high. Regulatory silence must not be mistaken for compliance.
3. Persistent Severe Injuries
Severe jobsite injuries remain a constant baseline hazard. Across Federal OSHA jurisdictions, 1,639 severe injuries were reported in the construction sector from January through November 2025, driven by systemic failures in task-level controls like fall protection and machine guarding.
4. The Trap of Non-Synchronized Risk Signals
A dangerous assumption in procurement is that a contractor with an excellent safety record is inherently financially stable. Public records prove that financial continuity, safety performance, and compliance readiness operate independently of one another. Strength in one pillar cannot compensate for a failing signal in another.
The Solution: A Unified, Pillar-Weighted Framework
How to effectively capture and neutralize these divergent signals? Deploying a data-driven methodology helps to track risk drift within five core operational domains. Continuous tracking prevents mid-build default or compliance failure across:
- Financial Continuity: Tracking real-time credit degradation, liens, and payment delays.
📈 Financial exposure metrics to measure: - Working capital velocity: Tracks cash flow degradation or depletion of liquid reserves needed for payroll and materials.
- Debt-to-equity acceleration: Flags over-leveraged contractors who may cut corners on project investment.
- Bonding capacity utilization: Monitors sudden drops in available surety credit or increased premium requirements.
- Payment delinquency trends: Identifies slow-paying tiers that signal lower-chain default risks.
- Safety Exposure: Monitoring severe injury reports (SIRs) and workers' compensation trends.
📈 Metrics to measure: - Lagging-to-leading ratio shift: Measures spikes in minor incidents or near-misses before major OSHA/HSE recordable injuries occur.
- Regulatory Exposure: Auditing active OSHA/HSE citations and enforcement actions.
📈 Metrics to measure: - Citation frequency velocity: Tracks new regulatory fines, stop-work orders, or environmental infractions.
- Supervisory turnover rate: Flags loss of certified safety personnel or experienced field leadership.
- Delivery & Capacity: Assessing project backlogs, labor shortages, and equipment constraints.
- Compliance Readiness: Ensuring continuous validation of insurance, licenses, and certifications.
📈 Metrics to measure: - Insurance modification spikes: Monitors sudden upward adjustments in Experience Modification Rates (EMR).
By weighting these pillars dynamically, risk management evolves from a passive administrative exercise into an active, predictive shield for your capital projects.
How to Construct the Risk Drift Index?
- Weight assignments: Assign proportional numerical weights to financial health (e.g., 40%), safety performance (e.g., 35%), and regulatory compliance (e.g., 25%).
- Baseline calibration: Set a Day-0 prequalification benchmark score during initial onboarding.
- Trigger thresholds: Establish velocity metrics (rate of change over 30/60/90 days) to issue automated yellow or red alerts when drift exceeds safe limits.
The Risk Drift Score Formula
The total drift score measures the cumulative, weighted deviation from the initial baseline. It ranges from 0 (No Drift / Stable) to 100 (Maximum Drift / Critical Risk).

Where:
- Wi: The assigned weight of category (i), where the sum Wi = 1.0 (or 100%).
- Di,t: The normalized component drift score for category (i) at time (t).
💡 Example:
A scenario applying standard category weights to a contractor 90 days into a project.
Category Weights (Wi)
- Financial Health (W1): 0.40 (40%)
- Safety Performance (W2): 0.35 (35%)
- Regulatory Exposure (W3): 0.25 (25%)
Category | Metric | Baseline | Current (Vt) | Variance % | Component Drift Score (Di,t) | Weighted Contribution |
|---|---|---|---|---|---|---|
Financial | Working Capital | $500,000 | $350,000 | -30% | 30 | 0.40 X 30 = 12.0 |
Safety | EMR Rating | 0.85 | 1.10 | +29.4% | 29.4 | 0.35 X 29.4 = 10.3 |
Regulatory | Open OSHA Fines | 0 | 2 | New Volatility | 40 (Flat Penalty) | 0.25 X 40 = 10.0 |
The overall Risk Drift Score is 32.3 out of 100.
From Detection to Owned Action: A 6-Step Checklist for Managing Subcontractor Risk
It is of no use to detect 'drift' unless it leads to actual control actions. To keep the project ready and ensure legal defensibility, industrial companies should implement a structured operational workflow.
- Register: Maintain real-time risk registers tied to legal entities, active sites, and individual projects, ideally within an integrated industrial risk intelligence platform.
- Link the incoming risk signals (for example, OSHA citations or legal filings) to the relevant controls, thresholds, and internal owners.
- Verify: Collect and validate incident facts and insurance/financial evidence rather than accepting self-reported updates.
- Contact: Automate contractor follow-ups to close compliance gaps faster. Automated communication with contractors and suppliers is useful when evidence is about to expire or when risk thresholds are reached.
- Escalate: Raise unresolved issues by referring them up the chain of command in accordance with the project's level of criticality. Set up standard escalation procedures based on both the project's criticality and the signal's severity (for example, repeated or willful citations lead to a mandatory control review).
- Sync: make sure all systems are updated in order to maintain a clear 'decision trail'. Ideally, you would receive verified risk status updates directly into one third-party risk management platform and feed those insights back into ongoing contractor risk and compliance work.
The New Rules for Managing Contractor Risk in 2026
A single annual review can no longer adequately show a contractor's continued readiness or stability. Since public risk signals are constantly changing, your risk controls must change too. Project leaders can identify risk drift early and act well before a crisis arises on site by replacing periodic checks with automated, continuous monitoring.
If your top contractor went into high-risk territory tomorrow, would your systems pick it up before the first project delay, or only six months later when the obsolete annual review takes place?
If you wish to protect your organization from the legal and regulatory consequences that come after a contractor's work has 'drifted', then get in touch with the Parakeet Risk team!
This analysis extracts the most important findings from public sources, such as OSHA releases, to help organizations move from a system of static approvals to one based on intelligence-driven monitoring.

Written by
The Parakeet TeamIndustrial risk insights from the Parakeet Risk team.

-1.jpg)