

In this article
- Key Contractor Safety Metrics and Why They Matter
- How Safety Scores are Calculated
- Lagging vs. Leading Indicators: Metrics for Assessing Contractor Prequalification
- 1. Lagging Indicators: What Are They?
- 2. Leading Indicators as Proactive Safety Measures
- Why Relying Solely on Past Metrics is Misleading?
- Best Practices for Implementing Contractor Safety Metrics
- How Automated Risk Platforms Process Contractor Safety Data
- Sources:
Contractor safety ratings are the cornerstone of effective third-party risk management. But how do you balance historical lagging metrics with proactive leading indicators to get an accurate view of a subcontractor's true risk profile? For risk professionals, knowing how these ratings are calculated is crucial for prequalifying contractors, mitigating financial risk, and ensuring job site safety.
Key takeaways:
- What do metrics like TRIR and EMR mean for construction third-party risk?
- How do safety scores quantify both historical incident liabilities and daily field practices?
- What's the difference between lagging and leading indicators?
- Practical ways to use OSHA ratings to simplify compliance and select reliable third-party partners.
We break down for you the core elements of contractor safety ratings. Let's examine how modern risk management platforms use these metrics to streamline subcontractor prequalification. No matter where you hold risk responsibility—whether in construction, manufacturing, or energy—this guide explains how to apply the scores smartly to mitigate third-party risk.
Read on to learn how to evaluate these metrics, properly vet external partners, and elevate safety standards across your construction projects.
Key Contractor Safety Metrics and Why They Matter
In the U.S., regulators, industry groups, and rating organizations rely on standard safety metrics. These benchmarks give companies clear visibility into how vendors manage risk on the ground, making it easier to evaluate contractors quickly without compromising on compliance or safety.
➡️ Learn how to verify that your subcontractors have compliant, site-specific fall protection protocols in place. Mitigating OSHA Liability: The Role of a Fall Protection Plan
Beyond generating a final prequalification score, organizations leverage contractor safety metrics for several critical operational functions.
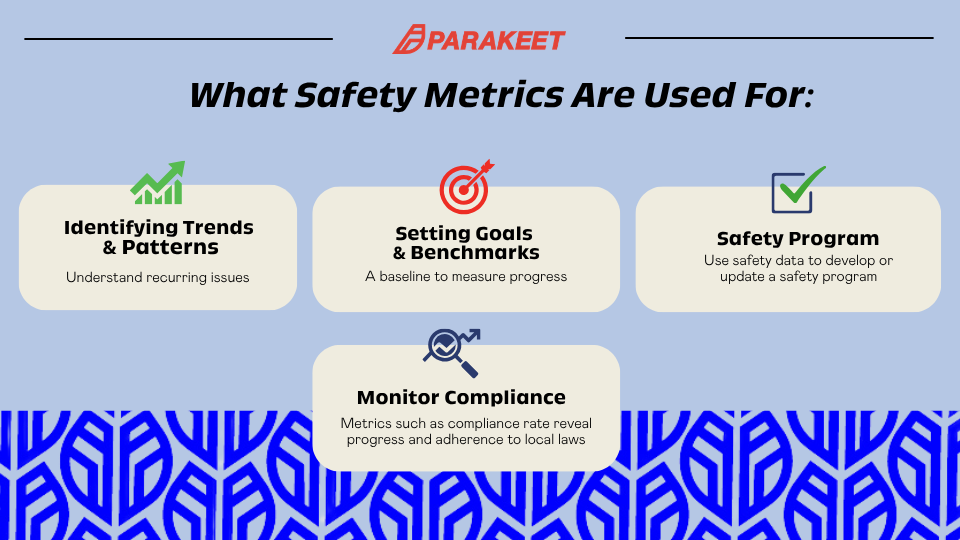
Industrial and construction firms rely heavily on safety ratings to measure how third-party contractors manage risk and stick to safety standards. Understanding these ratings helps organizations build safer workplaces, control incident-related costs, and ensure compliance across all projects.
How Safety Scores are Calculated
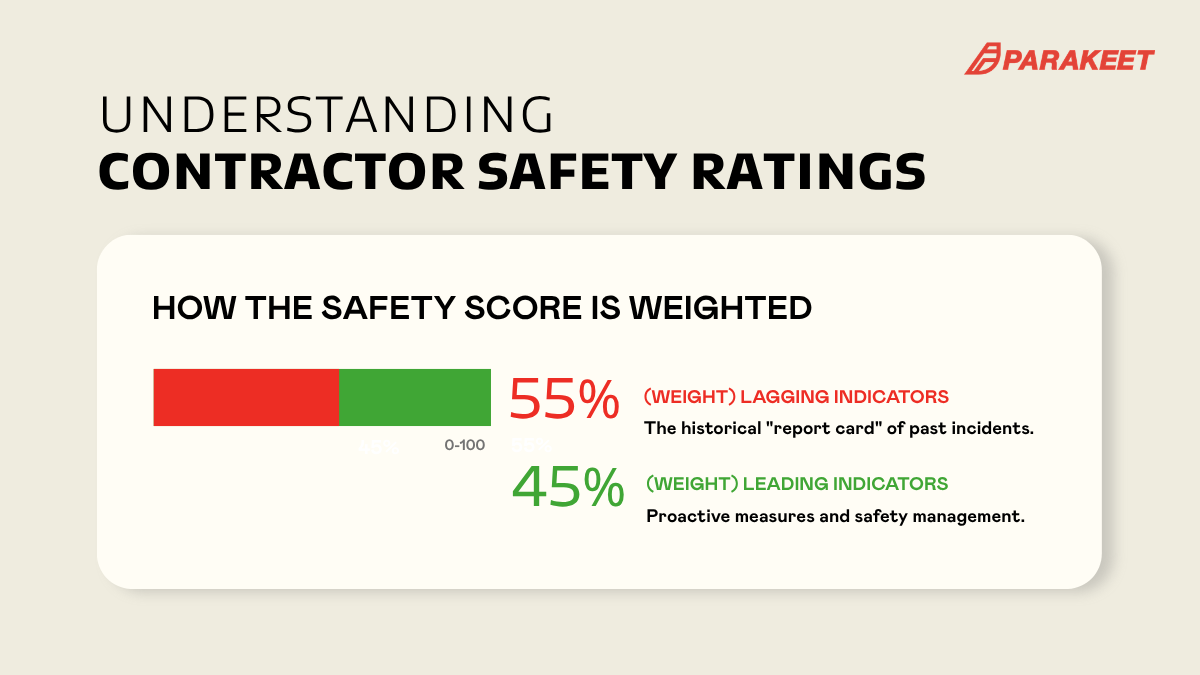
When evaluating a vendor, modern safety scores are calculated on a 0-100 scale to determine overall risk. To provide a balanced assessment, this rating is determined by how the safety score is weighted between two distinct categories:
- Lagging Indicators (55% Weight): This metric serves as the historical "report card" of past incidents.
- Leading Indicators (45% Weight): This metric evaluates a contractor's proactive measures and safety management.
Lagging vs. Leading Indicators: Metrics for Assessing Contractor Prequalification
Automated risk management platforms process key safety metrics to calculate objective safety scores and confirm whether a contractor is qualified to work on-site. Modern evaluations typically weight these scores by combining historical data (Lagging Indicators) with proactive measures (Leading Indicators).
1. Lagging Indicators: What Are They?
OSHA defines lagging indicators as reactive, backward-looking metrics that track the frequency and severity of past failures—such as workplace injuries, illnesses, and fatalities. In short, they measure incidents and financial liabilities that have already materialized.
Lagging indicators reveal the story of what has already occurred, helping risk managers determine if a contractor has a history of accidents.
Core examples include:
- Total Recordable Incident Rate (TRIR): Measures the number of OSHA-recordable injuries per 100 workers.
- Formula: OSHA Recordable Incidents × 200,000 / Total Hours Worked.
- The Benchmark: The target threshold for hiring is typically set at ≤ 2.0. High scores usually result in automatic disqualification or trigger a formal risk review.
- Days Away, Restricted, or Transferred (DART) Rate: Tracks severe incidents resulting in lost or restricted workdays.
- The Benchmark: The standard for contractor prequalification mandates a target score of ≤ 1.5.
- Experience Modification Rate (EMR): An actuarial metric based on a 3-year history of workers' compensation claims.
- The Benchmark: A score of 1.0 represents the industry baseline, and the target threshold is ≤ 1.0. A score above 1.0 signals elevated insurance and operational risk, often leading general contractors to refuse to hire the supplier.
- OSHA Citation History: A 3- to 5-year review of regulatory violations. Automated platforms specifically highlight Willful or Repeat citations, as they indicate a pattern of unaddressed hazards and heightened legal liability under OSHA workplace safety standards.
💡 Did You Know?
For high-risk sectors like construction, these historical data points are essential for establishing a vendor's baseline compliance. By analyzing metrics like TRIR, risk professionals can identify long-term incident patterns and determine whether a subcontractor has historically met minimum safety requirements on previous projects.
The Limitation of Lagging Metrics
Lagging metrics measure failures. They only reflect incidents that have already happened and do not account for current safety practices. For small and medium-sized contractors, lagging indicators can be highly distorted; a single minor injury can cause a disproportionate spike in their TRIR, painting an inaccurate picture of their actual risk profile.
2. Leading Indicators as Proactive Safety Measures
Leading indicators are preventative and predictive measures that assess safety activities before an incident occurs. While lagging metrics measure failures, leading metrics drive improvement. Ultimately, leading indicators reveal whether a contractor has robust, active safety management systems in place, proving they can control job site hazards rather than simply reacting to past liabilities.
Key Leading Indicators for Contractor Prequalification:
Leading Indicator | Description | Risk Management Impact |
|---|---|---|
Safety Training & Certification Rates | Tracking the percentage of workers holding valid, non-expired credentials (e.g., OSHA 10/30, specialized trade certs). | Proves workforce competency, prevents "ghost workers" with lapsed credentials from entering the site, and significantly lowers incident likelihood. |
Pre-Task Planning & JHA Completion | Frequency of Job Hazard Analyses (JHAs) and pre-shift toolbox talks completed before work begins. | Demonstrates that the contractor proactively identifies changing daily hazards rather than relying on generic, static safety manuals. |
Near-Miss & Hazard Observation Reporting | The volume of near-misses and unsafe conditions reported by field workers. | High reporting rates indicate a strong safety culture; low rates often signal a fear of retaliation or poor management engagement. |
Inspection Close-Out Timing | How quickly a contractor resolves and closes out corrective actions after a safety inspection. | A fast close-out time proves that hazards are actively fixed, whereas delayed close-outs expose the project to prolonged liability. |
Near-Miss Reporting | Number of near-miss events reported and investigated. | Highlights potential issues and prevents future incidents by addressing root causes. |
Corrective Action Implementation | Percentage of corrective actions completed on time after an inspection. | Ensures prompt resolution of identified issues, improving overall safety conditions. |
Tool and Equipment Maintenance | Regular, thorough maintenance of tools and equipment. | Reduces likelihood of equipment failures that could lead to injuries. |
Supervisor Field Observation Frequency | The regularity of leadership actively conducting safety walk-throughs and site audits. | Confirms that safety is driven by management on the ground, rather than just being a paperwork exercise managed from an office. |
For small and medium-sized contractors, relying strictly on lagging metrics can be highly misleading, as a single minor injury can cause a disproportionate spike in their TRIR. To correct this distortion, modern automated risk platforms heavily weight leading indicators. To evaluate a contractor's true safety culture, you should look for concrete evidence of risk management, including:
- Written Programs: Verification of hazard-specific safety protocols tailored to jobsite risks (e.g., Fall Protection, Lockout/Tagout).
- Training & Certifications: Ratios of personnel holding OSHA 10/30 cards or special credentials.
- Management Systems: Leadership involvement, audits, and proactive site onboarding programs.
For highly complex or hazardous projects, evaluating a contractor requires looking at advanced process safety metrics. High-performing organizations, such as those participating in OSHA’s Voluntary Protection Programs (VPP)—the premier U.S. standard for safety excellence. VPP participants track specialized leading indicators to prevent catastrophic failures, including Management of Change (MOC) systems to review equipment modifications, Preventive Maintenance (PM) and Mechanical Integrity (MI) tracking to eliminate overdue safety-critical work orders, and the completion status of Process Hazard Analyses (PHAs).
➡️ Learn how Cal/OSHA handles: Successor Liability in California: Key Insights on Cal/OSHA Citations for Industrial Buyers
Furthermore, top-tier contractors proactively monitor their own site-specific operational metrics while working on host sites—logging near-miss incidents, first-aid cases, completed Job Hazard Analyses (JHAs), and internal audit resolutions. In dynamic sectors like construction and heavy industry, where shifting conditions and tight schedules accelerate risk, relying on these predictive insights ensures safety is a continuous, forward-looking strategy rather than a reactive afterthought.
3. Financial & Operational Insurance Metrics
A contractor’s excellent safety record means little if their insurance coverage is insufficient, creating financial risk. Inadequate insurance coverage creates substantial financial risk—particularly on projects utilizing Subcontractor Default Insurance as part of their risk strategy.
By focusing on these metrics, organizations can effectively evaluate safety and make safer, compliant choices when selecting contractors.
- Verification of the Certificate of Insurance (COI): Automatically comparing current coverage with the project's minimum requirements (for example, General Liability, Workers’ Compensation, and Umbrella policies).
- Contractor Qualification Rates: Tracking the proportion of vendors meeting initial entry criteria. Low qualification rates can signal supply-chain vulnerabilities, helping teams adjust sourcing or vendor support strategies.
Why Relying Solely on Past Metrics is Misleading?
Standard safety evaluations frequently depend on TRIR, EMR, and DART rates. While these figures summarize past compliance, they do not accurately predict future performance or current operational risks. Combining past data with proactive management systems creates a highly accurate, predictive snapshot of a subcontractor's true risk profile.
Metric Type | Examples | What It Tells You |
|---|---|---|
Lagging Indicators (Past) | TRIR, EMR, DART. | The Outcomes: How many people were injured and how much did those injuries cost in the past? |
Leading Indicators (Future) | JHA completion rates, safety inspections, training credentialing. | The Prevention: Are proactive safety management tools actively being used to stop the next accident? |
Best Practices for Implementing Contractor Safety Metrics
Tracking key indicators allows risk management teams to proactively address third-party hazards before work begins and maintain strict regulatory compliance.
➡️ Discover why static safety scores aren't enough: How is Continuous Monitoring Tackling Contractor Risk Drift in Construction?
To implement these metrics effectively, leading organizations follow these core strategies:
- Balance Leading and Lagging Indicators: Combine historical data (such as TRIR and EMR) with proactive metrics (like training completion ratios) to gain a comprehensive view of overall safety performance and predict future risk.
- Centralize and Automate Data Collection: Relying on static questionnaires leaves you vulnerable to outdated information. Use automated risk management platforms to centralize data, support validation, and maintain ongoing visibility across the entire contractor lifecycle.
- Establish a Formal Compliance Framework: Successfully managing contractor risk requires a structured framework. This must include upfront prequalification, rigorous safety documentation review, continuous insurance validation, and ongoing subcontractor oversight once they are on site.
- Require Scope-Specific Safety Plans: Ensure that contractors have compliant safety documentation tailored to the specific hazards of your jobsite (e.g., Fall Protection Plans, Lockout/Tagout procedures, or Confined Space protocols).
- Verify Active Workforce Qualifications: Track the percentage of site workers holding required, non-expired credentials (such as OSHA 10/30 cards) and confirm that designated Competent Persons are assigned to specialized operations like scaffolding.
- Schedule Periodic Requalification: A contractor's risk profile can change after onboarding. As liabilities evolve, it is vital to periodically requalify your contractors to ensure continued compliance and project integrity.
- Integrate Safety into Operational Workflows: Make safety an integral part of operations by using safety metrics as essential operational tools, rather than just treating them as compliance checklists. Align metrics with broader business goals and encourage site crews to report near-misses and hazards promptly.
However, risk managers must remember that simply tracking metrics will not independently prevent incidents.
To truly mitigate third-party risk, safety data must be paired with real-time job site observations and actively integrated into broader operational workflows to drive continuous, predictive safety improvements.
How Automated Risk Platforms Process Contractor Safety Data
Following safety metrics across hundreds of subcontractors in spreadsheets often leads to missed policy expirations or outdated EMR scores. To build a comprehensive subcontractor risk assessment program, general contractors and owners utilize modern tools to balance lagging metrics with proactive, forward-looking leading indicators.
Platforms like Parakeet Risk pull data directly from insurance carriers and regulatory databases to generate dynamic scorecards, helping compliance teams monitor contractor risk in real time.
By streamlining incident report collection and automating subcontractor prequalification, industrial organizations can build more efficient worksites.
We help risk managers track contractor compliance, mitigate supply-chain vulnerabilities, and make informed procurement decisions based on reliable, multi-faceted data. Book a demo to learn how we can streamline your subcontractor prequalification process.
For more insights about risk management and safety culture, visit the Parakeet Risk Blog.
Sources:
- Occupational Safety and Health Administration (OSHA). "The Use of Metrics in Process Safety Management (PSM) Facilities" (OSHA 3896). Available at:https://www.osha.gov/sites/default/files/publications/OSHA3896.pdf
- Occupational Safety and Health Administration (OSHA). "Using Leading Indicators to Improve Safety and Health Outcomes." Available at:https://www.osha.gov/sites/default/files/publications/OSHA_LEADING_INDICATORS.pdf

Written by
The Parakeet TeamField notes from the people building continuous risk engineering for industrial operations.
.png)
