In this article
- Where industrial fires present the greatest financial risk?
- The $100 Million Anomaly: Fires vs. Hazardous Conditions
- Operational vs. Static Risk: Why Factories Suffer 2.3x More Loss Than Warehouses
- The Regulatory Paradox: Internal Facility Failure vs. External Smoke Mandates
- Cal/OSHA Title 8 Section 5141.1 (Wildfire Smoke Protection)
- Continuous Thermal Load & Ventilation Trade-Offs
- Structural Hardening of The California Wildland-Urban Interface Code (CWUIC - Title 24, Part 7)
- Why standard fire reports actually underestimate the true risk profile of your plant
- Key Takeaways for Plant Safety: Engineering for the 1% Risk Imperative
In 2025 fire departments attended 18,828 incidents at factories, warehouses and storage buildings across the US. The inevitable question for safety people and risk managers after such an event is: where does the money go when things go wrong?
Every year the industrial risk managers and plant directors go through the same compliance checklist: fire extinguisher inspections, basic employee drills, and standard shop floor housekeeping. When something goes wrong, the first thing you do is ask how you stop the most frequent flare-ups.
But the empirical incident data speaks a very stark truth about industrial property protection: your most frequent hazards are by no means the ones that are going to impact your balance sheet.
As per the most recent NFIRS 2025 data release from FEMA and the USFA, the risk of industrial fire is extremely heavy-tailed. Most events are trivial, but a tiny number account for almost all the financial damage. True balance sheet protection means moving away from normal day-to-day friction and deliberately engineering your systems to survive the catastrophic 1%.
Most incidents are minor, but a very small number are huge, and those few cause most of the cost.
Based on our analysis of the NFIRS 2025 Public Data Release from the US Fire Administration we've put together a report that shows a huge concentration of financial risk.
Where industrial fires present the greatest financial risk?
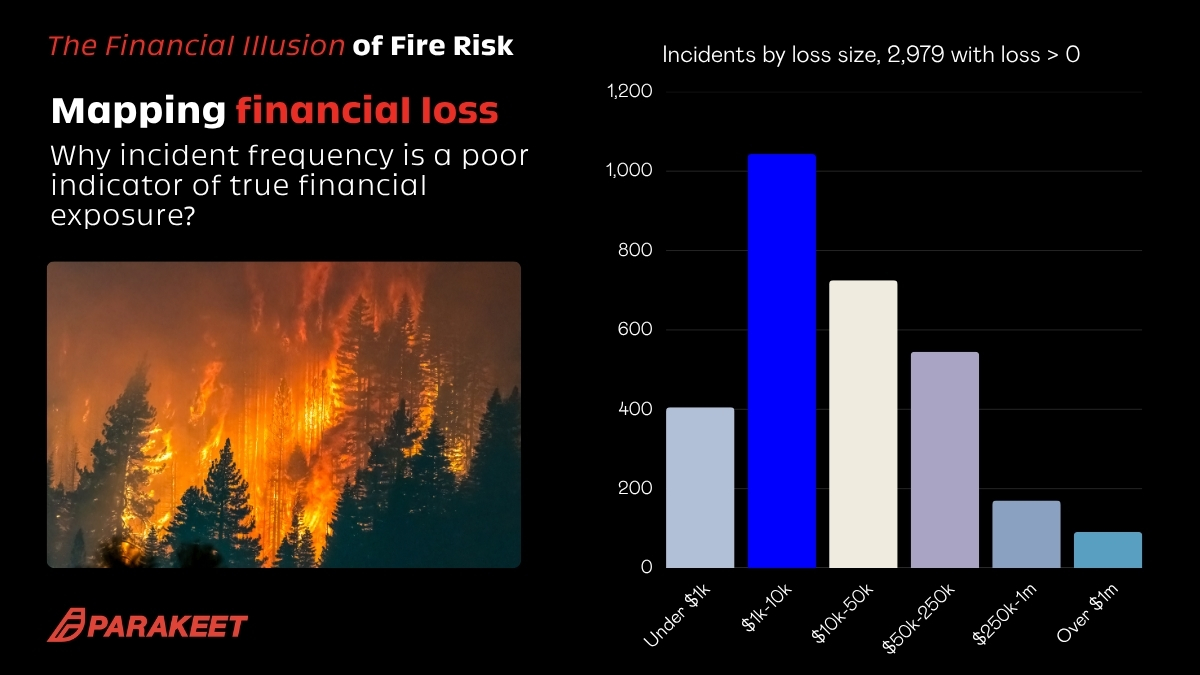
Of the over 2.1 million emergency records scanned across the country, a small group of industrial sites (manufacturing plants, warehouses, cold storage, grain elevators, etc.) accounted for 18,828 incidents. Of those, only 2,979 industrial incidents reported a direct property loss greater than zero.
For most facilities, the financial impact of a response call is very low. The median reported loss is $10k. Over 72% of the loss-reporting incidents never go above $50k.
Breaking down the 2,979 incidents that resulted in financial damage reveals where the damage truly concentrates:
- 405 incidents cost under $1,000
- 1,043 incidents cost between $1,000 and $10,000, making this the most common loss tier
- 725 incidents cost between $10,000 and $50,000
- Only 91 incidents nationwide surpassed the $1 million mark
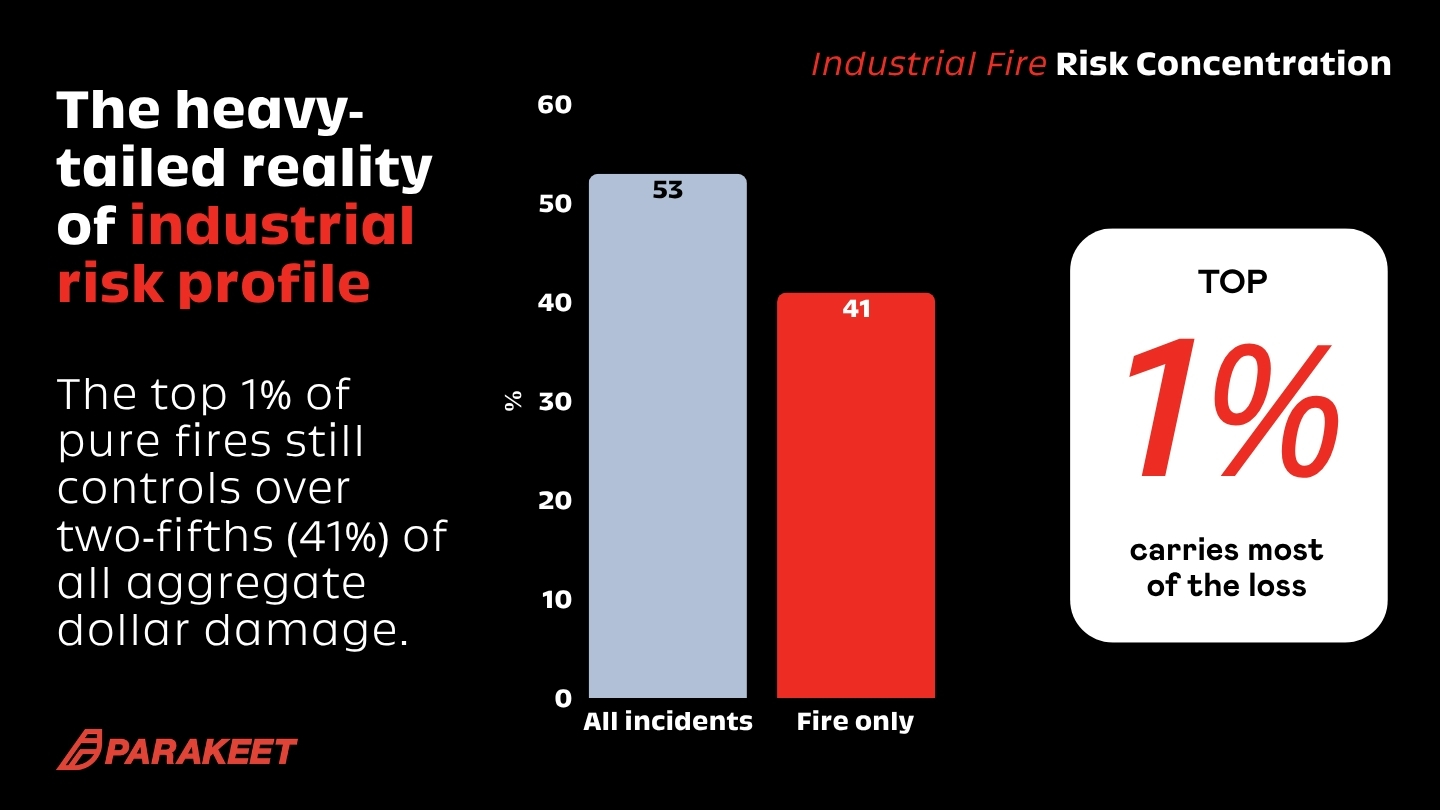
If you're managing your risk budget based on averages or high-frequency incident trends, you're optimizing for the middle of the curve (the minor shop floor flare-ups that cost under $50k). Look at the total aggregate damage, though, and it's a massive $456,418,743. That number isn't driven by a high volume of small fires. It results entirely from very rare tail events. In fact, 1% of industrial incidents account for 53% of all reported property loss.
The $100 Million Anomaly: Fires vs. Hazardous Conditions
To build a resilient defense, you have to separate the run-of-the-mill fires from the structural anomalies. The single biggest event in the 2025 dataset was a $100m loss in Alabama.
Crucially, the local responders classified it as a 'hazardous condition' (Type 440) rather than an active fire. That one event alone took 22% of the entire narrow industrial total.
Even if you look only at active fires (ignore the hazardous-condition anomaly), the tail risk remains. It just becomes a very dangerous reality: the top 1% of pure fires still account for 41% of total financial loss. Whether you're looking at a runaway fire or a catastrophic hazardous release, your risk profile is still overwhelmingly dominated by low-probability, high-consequence events.
Operational vs. Static Risk: Why Factories Suffer 2.3x More Loss Than Warehouses
Where should you be putting your capex for maximum risk mitigation? The data tells a clear story about the economic divergence based on how an industrial property is used.
The data shows a distinct financial split between facility types:
- Manufacturing and processing operations bear most of the financial burden, amounting to around $321m of the reported loss.
- Storage and warehousing came in at a much lower figure of around $135m.
Manufacturing and processing facilities took the worst knock, with $321m in reported losses versus $135m for storage and warehousing.
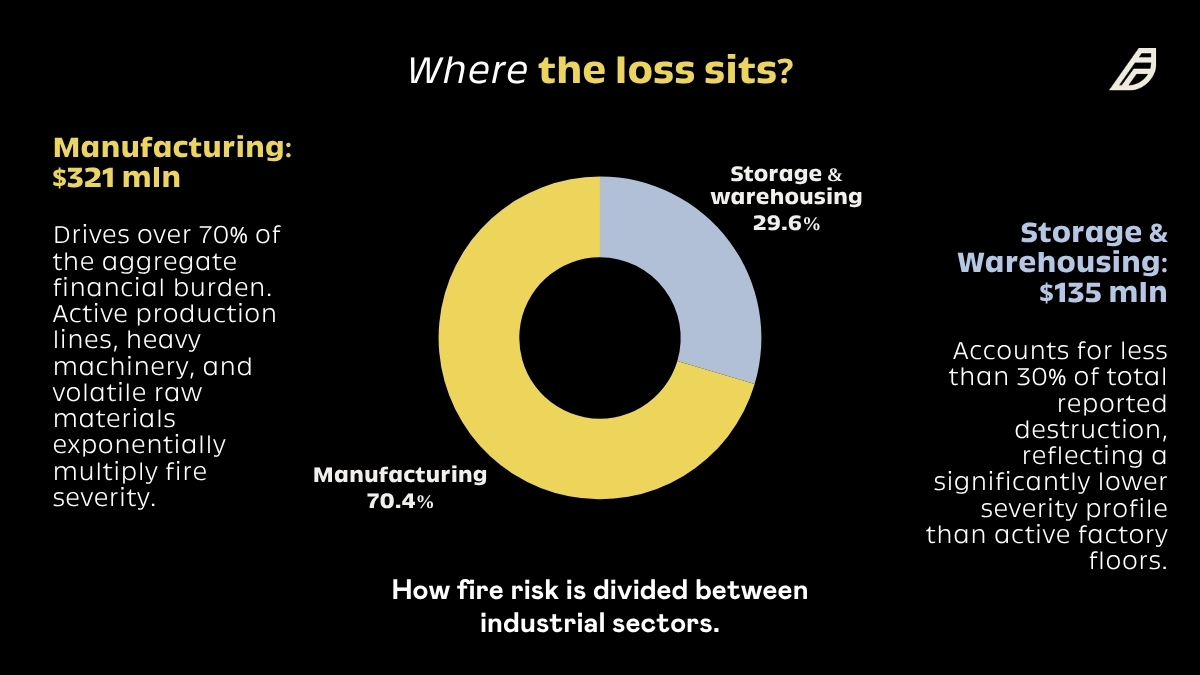
Factories bear over 2.3 times the aggregate dollar damage of warehouses. For the risk manager, this distinction between the hazards of a static storage facility and an operational facility is critical. The production environment is highly volatile, with active production lines, high-temperature machinery, flammable raw materials, and a continuous thermal load. A small ignition event in such an environment can very quickly escalate into a runaway, uncontained tail event.
The Regulatory Paradox: Internal Facility Failure vs. External Smoke Mandates
The data is clear: manufacturing facilities suffer 2.3x more dollar damage ($321m) than the static warehouses ($135m). California law, however, requires operators to consider the impact of an external wildfire, which could bring a facility to a complete standstill in minutes. If you're running a facility in California, you know firsthand that managing internal fire hazards is only half the battle; you're also caught in a regulatory tug-of-war when wildfire season hits. Rules designed to protect your workforce from the outside environment can create competing pressures that compromise your plant's internal safety.
Cal/OSHA Title 8 Section 5141.1 (Wildfire Smoke Protection)
Even if the factory or warehouse itself doesn't catch fire, an encroaching wildfire will trigger significant compliance requirements if the PM2.5 AQI reaches 151 or above.
- The Mandate: Employers must monitor the local AQI, put in place engineering controls (e.g. advanced HVAC filtration), change work schedules, or provide NIOSH-approved N95 respirators for voluntary use.
- The Threat of Forced Shutdowns: When external smoke rolls in and the local AQI hits 151, regulations require you to deploy engineering controls or N95 respirators. If conditions worsen and the AQI breaks 500, a lack of available controls or respiratory protection forces a mandatory shutdown—turning a distant wildfire into an immediate, costly business interruption.
Continuous Thermal Load & Ventilation Trade-Offs
Cal/OSHA mandates minimum outdoor air ventilation rates for industrial facilities (Title 8, Section 5142). However, during a wildfire, pulling in that outside air means sucking in heavy particulate matter. This smoke can actually blind the early thermal detection systems on your operating floors, masking the exact internal risks you're trying to prevent.
Structural Hardening of The California Wildland-Urban Interface Code (CWUIC - Title 24, Part 7)
The BAC report makes it very clear that 45% of the homes built in California between 1990 and 2010 were in the WUI. That's driven commercial logistics, processing plants, and cold storage facilities right into high-hazard areas.
To survive what the industrial fire data refers to as the 'heavy tailed reality' (i.e. 1% of the fires account for 53% of the reported property loss) California has completely restructured its environmental building requirements.
To defend against these external threats, the California Wildland-Urban Interface Code requires facilities to restructure their environmental building defenses. This includes prohibiting unrated wood shingles in high-hazard zones and enforcing a mandatory 5-foot non-combustible "Zone Zero" buffer around the building to block sweeping embers.
Consolidating disparate fire and building regulations, this single code is a significant step for any facility applying for new permits or altering the exterior envelope of an existing building.
- Strict material defenses: The code prohibits cedar shakes and non-rated wood shingles in the High and Very High Fire Hazard Severity Zones.
- Zone Zero Mandates: In line with the new defensible space concepts, facilities are assessed heavily on the presence of a non-combustible 5ft buffer zone around the building itself to prevent embers from sweeping through the industrial yards.
- The financial return: whilst structural hardening will involve an up-front capital outlay, homes and commercial buildings constructed to California's modern WUI standards are up to 40% less likely to be totally destroyed in the event of an extreme tail event, effectively flattening the severity curve, which is the very thing that financial managers are so anxious about.
Why standard fire reports actually underestimate the true risk profile of your plant
Understanding how the federal fire incident data is compiled is absolutely fundamental to any risk analysis. Don't just accept historical data models as gospel and use them to justify your safety budgets to the C-suite. You need to be 100% clear on three very serious systemic problems with how federal data is collected.
- Initial Scene-of-Fire Estimates vs. Reality
These are the fire damage estimates as provided by the local fire departments on the day of the incident. They are not the final insurance settlements; they don't account for downstream business interruption to the supply chain, and they certainly don't factor in long-term reputational damage. The actual financial impact to the business will be far, far greater.
- Missing & Rounded Data: The Blank Field Phenomenon
Approx. 40% of the dollar loss fields in the reporting database are blank. A blank field doesn't mean a $0 loss; it just means the data hasn't been recorded. Also, 79% of the losses reported are rounded to the nearest $1,000.
- Missing Technical Data
The specialist fire module (detailing ignition sources and material behavior) is completely absent for 36% of reported fires.
Key Takeaways for Plant Safety: Engineering for the 1% Risk Imperative
For the industrial operator, the imperative is to manage the day-to-day risks to achieve a baseline level of safety. True balance sheet protection, however, requires planning for the 1% of incidents that will carry over 50% of the financial impact.
- Design for tail-event containment: you can't prevent major enterprise damage by just mitigating the small, frequent ignition events. 1% of fires account for 41% of total industrial fire loss, so passive compartmentalization, high-density automatic sprinkler coverage, and early thermal detection must all be designed to contain the tail event (the worst-case runaway fire).
- Harden the active manufacturing areas as factories suffer by far the highest loss rates of any site type. Prevention resources must therefore focus on hot production machinery, material handling equipment, and ignition control on active operating floors.
- Don't confuse incident frequency with financial hazard. A hundred common minor shop floor flare-ups can distract the safety team and obscure the low-probability, high-impact events that will, in fact, destroy the whole industrial complex.
The key insight is that incident frequency does not measure financial risk. You can have thousands of industrial fires that cost less than $50k. A facility's real risk is determined by its susceptibility to the 1% of fires that account for nearly half of all property damage. Once you appreciate the nature of that heavy-tailed distribution, you stop treating all your operational fire hazards as equally risky, and you start designing your active protection, compartmentation, and suppression systems to survive that catastrophic tail event.
*Note: These figures represent "reported loss"—estimates made at the scene by fire departments—not settled insurance claims or business interruption costs.

Written by
The Parakeet TeamField notes from the people building continuous risk engineering for industrial operations.