In this article
Whenever a pipeline experiences an accident—such as a leak, rupture, or spill—the operating company is legally required to report what happened and how much it cost to federal regulators. Is your organization prepared for the tail risks of tomorrow?
Beneath the surface of the United States lies an unseen energy highway. According to the Pipeline and Hazardous Materials Safety Administration (PHMSA), more than 228,000 miles of hazardous liquid pipelines crisscross the country, quietly moving roughly two-thirds of the nation’s crude oil and refined petroleum products every single day.
When a US pipeline carrying crude oil or fuel experiences an accident, the operator must report the incident—and its financial toll—to the Pipeline and Hazardous Materials Safety Administration (PHMSA).
To understand the true financial impact of these events, we collected 5,829 reportable hazardous liquid pipeline accidents from 2010 through 2025. The data reveals a stark financial reality: the vast majority of incidents are relatively inexpensive, while a tiny fraction of catastrophic events drives nearly all the cost.
Adjusted to constant 2025 dollars, these incidents generated $5.74 billion in operator-reported costs—a figure covering property damage, lost product, repairs, emergency response, and environmental cleanup (excluding legal fees and business interruption). Here is a breakdown of where that money actually goes.
The "Tail" Effect: 1% of Accidents Drive Nearly 70% of Costs
Behind that staggering $1.24 billion outlier—and the second-largest spill in the dataset—are two of the most consequential environmental disasters in modern US pipeline history:
- Michigan (2010): In July 2010, an Enbridge pipeline (Line 6B) ruptured near Marshall, Michigan, spilling over a million gallons of heavy diluted bitumen into Talmadge Creek and the Kalamazoo River. Because heavy crude sinks in water rather than floating, cleanup required five years of dredging and drove operator-reported costs past $1.2 billion—accounting for 95% of Michigan’s total pipeline accident costs over the entire 15-year period.
- Kansas (2022): In December 2022, a faulty weld and bending stress caused the Keystone Pipeline to rupture in Washington County, Kansas, releasing roughly 14,000 barrels of crude oil into Mill Creek. Beyond hundreds of millions in initial cleanup, the spill later resulted in a $70 million federal and state settlement over environmental restoration and safety upgrades.
Together, those two spills hold 33% of all reported costs from 2010 to 2025. Yet even if you filter out both outliers in the report, the costliest 1% of remaining accidents still drives 54% of the total cost.
The biggest takeaway:
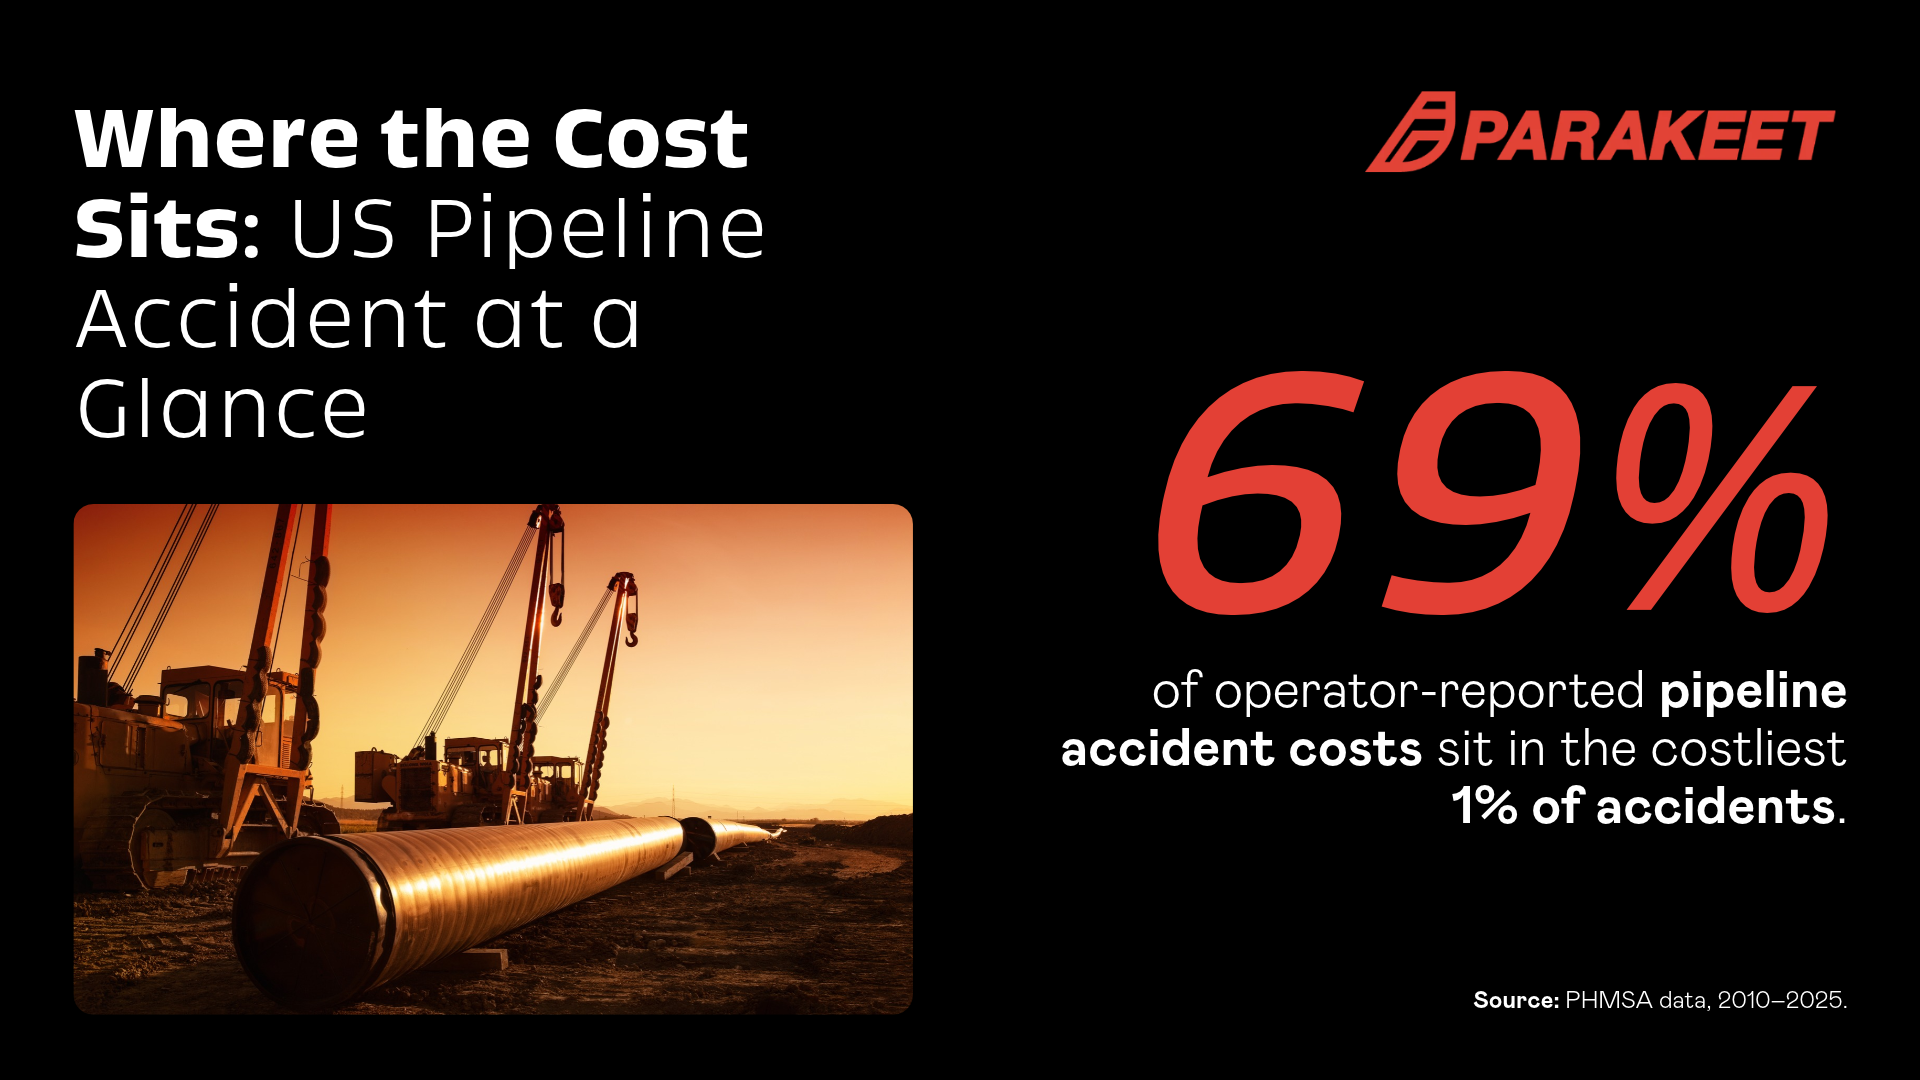
The worst 1% of accidents—just 58 out of 5,829—account for 69% of all the money.
The core facts:
- 5,829 total accidents,
- $5.74 billion in total reported costs,
- a typical accident cost of about $37,000,
- a single worst accident costing $1.24 billion.
Typical vs. Tail
In risk analysis, the "tail" simply refers to the rare, very expensive accidents at the extreme end of the spectrum.
- Half of all accidents cost less than $37,000 (the median).
- 1 in 10 accidents costs more than $740,000.
- 1 in 20 accidents costs more than $1.8 million.
- 1 in 100 accidents costs more than $11.0 million.
The reports reveal a major surprise: the most common causes of accidents are not the most expensive per incident.
- Equipment breaking is the most common cause, making up 46% of all accidents with a reported cost, yet these incidents are usually cheap, carrying a typical cost of just $17,000.
- Someone digging into the pipe by accident (excavation damage) is rare, representing only 3% of accidents, but it is usually very expensive—jumping more than twenty-fold to a median cost of $355,000.
Covering January 1 through July 31, 2026, early records show 178 accidents and $98 million in nominal cost estimates.
Because 55 of those 178 reports are not yet final (holding 44% of the current cost total) and companies will continue updating their cleanup figures over time, these provisional numbers will change and should not be compared directly with completed historical years.
In pipeline safety, averages can be misleading. Looking at the median incident, the typical US hazardous liquid pipeline accident has a reported cost of $37,000. However, as incidents become rarer, the financial impact climbs rapidly:
- 1 in 10 accidents costs more than $740,000.
- 1 in 20 accidents costs more than $1.8 million.
- 1 in 100 accidents costs more than $11.0 million.
Because of this steep curve, the costliest 1% of accidents—just 58 incidents out of 5,829—account for 69% of all reported costs.
Two historic crude oil releases—one in Michigan in 2010 (the single worst event at $1.24 billion) and another in Kansas in 2022—account for 33% of all reported costs combined. Yet even if you remove those two massive outliers from the dataset, the costliest 1% of remaining accidents still drives 54% of the total cost.
Frequent vs. Costly: Why the Rankings Flip
One of the biggest surprises in the data is that the most common causes of pipeline accidents are not the most expensive.
- Equipment failure is the most frequent culprit, accounting for 46% of all accidents with a reported cost. However, these incidents are usually contained quickly and carry a low median cost of just $17,000.
- Excavation damage (such as third-party digging into a pipe) is rare, making up only 3% of accidents. Yet when it happens, the median reported cost jumps more than twenty-fold to $355,000.
When looking at total cumulative dollars rather than per-accident medians, pipe or weld failure dominates, representing 50% of all reported costs ($2.86 billion)—or 25% when excluding the 2010 Michigan and 2022 Kansas spills.
Geography and Infrastructure: Where Losses Concentrate
Where an incident occurs on the network matters just as much as how it happens. While terminals, tank farms, breakout tanks, and pump stations experience the majority of accident counts, line pipe (the main cross-country transmission piping) accounts for 31% of accidents but absorbs 83% of the total reported cost ($4.79 billion).
Geographically, Michigan tops the state-by-state cost rankings at $1.31 billion, though 95% of that total stems from the single 2010 release. Kansas (0.70billion) and Texas (0.94 billion) follow closely behind.
2026 So Far—Why Incomplete Data Needs Its Own Space
One of the biggest traps in data journalism is comparing an unfinished year against completed historical years. Because 2026 is still underway, provisional data sits on its own dedicated page in the report.
Covering January 1 through July 31, 2026, early filings record 178 accidents and $98 million in nominal cost estimates. Crucially, 55 of those 178 reports are still marked as provisional (holding 44% of the current cost total). As investigations wrap up and multi-year environmental remediation bills come in, companies routinely update their PHMSA filings—meaning early 2026 figures will inevitably rise before they can be fairly measured against the past.
The Takeaway
When we talk about pipeline safety, averages hide the real story. Looking across 15 years of federal data—and independent watchdogs like the Pipeline Safety Trust—shows that pipeline risk is overwhelmingly driven by rare "tail" events. Preventing the next billion-dollar disaster doesn't just come down to fixing everyday leaks at pumping stations; it depends on catching structural weld flaws, preventing corrosion on aging mainlines, and ensuring nobody digs blindly into the ground.

Written by
The Parakeet TeamField notes from the people building continuous risk engineering for industrial operations.